29
/
en
AIzaSyAYiBZKx7MnpbEhh9jyipgxe19OcubqV5w
April 1, 2024
264982
Togo
TGO
true
2
1
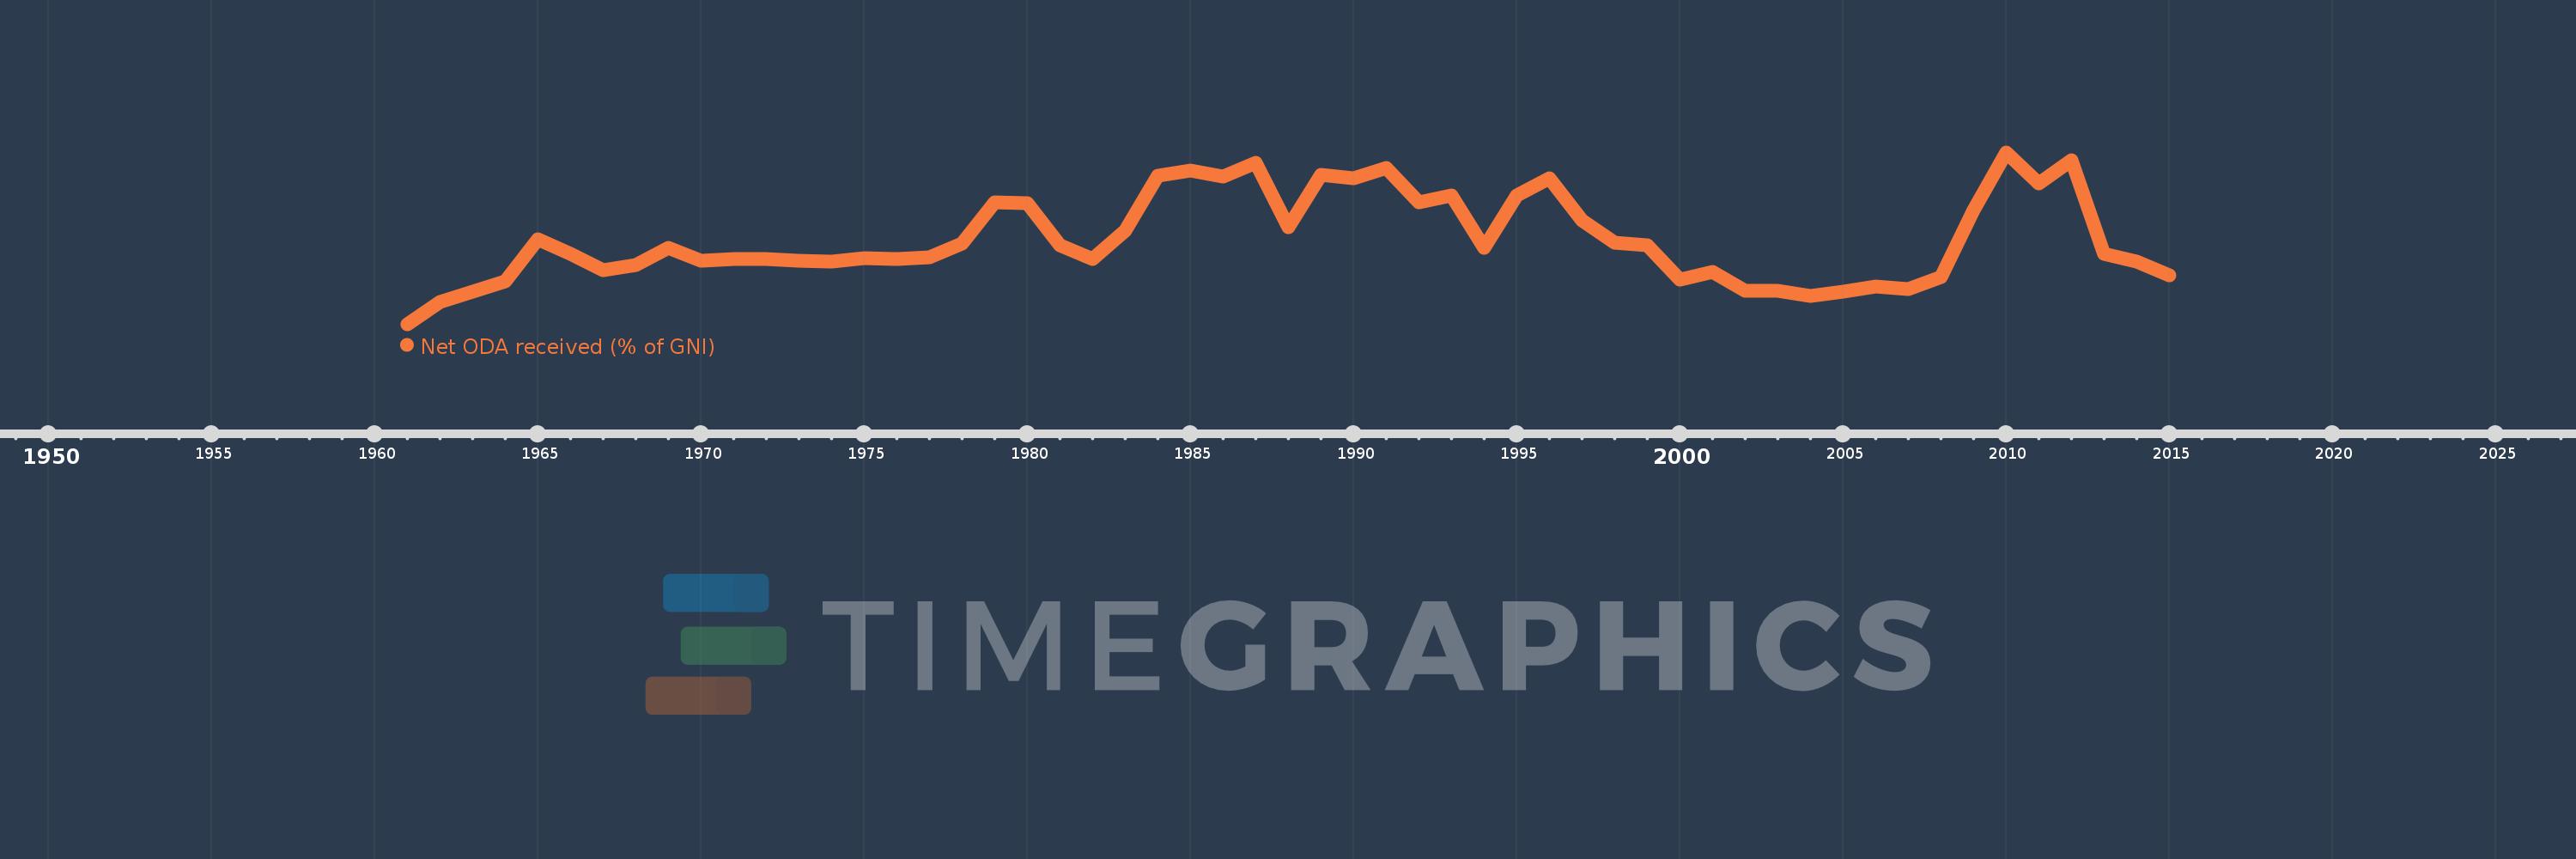
Net ODA received (% of GNI)
2015,2014,2013,2012,2011,2010,2009,2008,2007,2006,2005,2004,2003,2002,2001,2000,1999,1998,1997,1996,1995,1994,1993,1992,1991,1990,1989,1988,1987,1986,1985,1984,1983,1982,1981,1980,1979,1978,1977,1976,1975,1974,1973,1972,1971,1970,1969,1968,1967,1966,1965,1964,1963,1962,1961
This statistics in other country:
AfghanistanAlbaniaAlgeriaAngolaAntigua and BarbudaArab WorldArgentinaArmeniaAzerbaijanBahamas, TheBahrainBangladeshBarbadosBelarusBelizeBeninBermudaBhutanBoliviaBosnia and HerzegovinaBotswanaBrazilBrunei DarussalamBurkina FasoBurundiCabo VerdeCambodiaCameroonCaribbean small statesCentral African RepublicCentral Europe and the BalticsChadChileChinaColombiaComorosCongo, Dem. Rep.Congo, Rep.Costa RicaCote d'IvoireCroatiaCubaCyprusDjiboutiDominicaDominican RepublicEast Asia & PacificEast Asia & Pacific (excluding high income)East Asia & Pacific (IDA & IBRD countries)EcuadorEgypt, Arab Rep.El SalvadorEquatorial GuineaEritreaEthiopiaEuro areaEurope & Central AsiaEurope & Central Asia (excluding high income)Europe & Central Asia (IDA & IBRD countries)European UnionFijiFragile and conflict affected situationsFrench PolynesiaGabonGambia, TheGeorgiaGhanaGrenadaGuatemalaGuineaGuinea-BissauGuyanaHaitiHeavily indebted poor countries (HIPC)High incomeHondurasHong Kong SAR, ChinaIBRD onlyIDA & IBRD totalIDA blendIDA onlyIDA totalIndiaIndonesiaIran, Islamic Rep.IraqIsraelJamaicaJordanKazakhstanKenyaKiribatiKorea, Rep.KosovoKuwaitKyrgyz RepublicLao PDRLatin America & Caribbean Latin America & Caribbean (excluding high income)Latin America & the Caribbean (IDA & IBRD countries)Least developed countries: UN classificationLebanonLesothoLiberiaLibyaLow & middle incomeLow incomeLower middle incomeMacao SAR, ChinaMacedonia, FYRMadagascarMalawiMalaysiaMaldivesMaliMaltaMarshall IslandsMauritaniaMauritiusMexicoMicronesia, Fed. Sts.Middle East & North AfricaMiddle East & North Africa (excluding high income)Middle East & North Africa (IDA & IBRD countries)Middle incomeMoldovaMongoliaMontenegroMoroccoMozambiqueMyanmarNamibiaNauruNepalNew CaledoniaNicaraguaNigerNigeriaNorth AmericaOECD membersOmanOther small statesPacific island small statesPakistanPalauPanamaPapua New GuineaParaguayPeruPhilippinesQatarRwandaSamoaSao Tome and PrincipeSaudi ArabiaSenegalSerbiaSeychellesSierra LeoneSingaporeSloveniaSmall statesSolomon IslandsSomaliaSouth AfricaSouth AsiaSouth Asia (IDA & IBRD)South SudanSri LankaSt. Kitts and NevisSt. LuciaSt. Vincent and the GrenadinesSub-Saharan Africa Sub-Saharan Africa (excluding high income)Sub-Saharan Africa (IDA & IBRD countries)SudanSurinameSwazilandSyrian Arab RepublicTajikistanTanzaniaThailandTimor-LesteTogoTongaTrinidad and TobagoTunisiaTurkeyTurkmenistanTuvaluUgandaUkraineUpper middle incomeUruguayUzbekistanVanuatuVenezuela, RBVietnamWest Bank and GazaWorldYemen, Rep.ZambiaZimbabwe Timeline:
This timeline shows a graph from 1961 to 2015 of Togo. No data until 1960. Number of actual observations by date: 55.
Source name:
World Development Indicators
Source organization:
Development Assistance Committee of the Organisation for Economic Co-operation and Development, Geographical Distribution of Financial Flows to Developing Countries, Development Co-operation Report, and International Development Statistics database. Data are available online at: www.oecd.org/dac/stats/idsonline. World Bank GNI estimates are used for the denominator.
Categories, topics:
Aid Effectiveness, Economy & Growth, External Debt
Last updated:
apr 23, 2017
Indicators value changes by year
Maximum:
17.783
jan 1, 2010
At the date of observation
Value
Absolute change
Change from previous value
jan 1, 1961
0.091
+0.091
0.0%
jan 1, 1962
2.341
+2.249
2.47K%
jan 1, 1963
3.422
+1.082
46.22%
jan 1, 1964
4.527
+1.105
32.29%
jan 1, 1965
8.826
+4.298
94.94%
jan 1, 1966
7.353
-1.473
-16.69%
jan 1, 1967
5.649
-1.704
-23.17%
jan 1, 1968
6.185
+0.536
9.49%
jan 1, 1969
7.991
+1.807
29.21%
jan 1, 1970
6.654
-1.337
-16.73%
jan 1, 1971
6.794
+0.14
2.1%
jan 1, 1972
6.831
+0.037
0.55%
jan 1, 1973
6.586
-0.245
-3.59%
jan 1, 1974
6.558
-0.028
-0.43%
jan 1, 1975
6.886
+0.328
5.01%
jan 1, 1976
6.808
-0.078
-1.14%
jan 1, 1977
6.954
+0.146
2.15%
jan 1, 1978
8.363
+1.409
20.26%
jan 1, 1979
12.675
+4.312
51.57%
jan 1, 1980
12.583
-0.092
-0.73%
jan 1, 1981
8.249
-4.334
-34.44%
jan 1, 1982
6.798
-1.451
-17.59%
jan 1, 1983
9.765
+2.967
43.64%
jan 1, 1984
15.367
+5.602
57.37%
jan 1, 1985
15.933
+0.566
3.68%
jan 1, 1986
15.285
-0.648
-4.07%
jan 1, 1987
16.725
+1.44
9.42%
jan 1, 1988
10.102
-6.623
-39.6%
jan 1, 1989
15.439
+5.336
52.82%
jan 1, 1990
15.159
-0.28
-1.81%
jan 1, 1991
16.161
+1.002
6.61%
jan 1, 1992
12.68
-3.481
-21.54%
jan 1, 1993
13.355
+0.675
5.33%
jan 1, 1994
7.937
-5.418
-40.57%
jan 1, 1995
13.387
+5.449
68.65%
jan 1, 1996
15.127
+1.741
13.0%
jan 1, 1997
10.799
-4.329
-28.61%
jan 1, 1998
8.504
-2.294
-21.25%
jan 1, 1999
8.207
-0.298
-3.5%
jan 1, 2000
4.645
-3.562
-43.4%
jan 1, 2001
5.497
+0.852
18.34%
jan 1, 2002
3.537
-1.96
-35.66%
jan 1, 2003
3.534
-0.002
-0.07%
jan 1, 2004
3.023
-0.511
-14.46%
jan 1, 2005
3.409
+0.386
12.78%
jan 1, 2006
3.968
+0.559
16.39%
jan 1, 2007
3.691
-0.278
-7.0%
jan 1, 2008
4.91
+1.22
33.05%
jan 1, 2009
11.813
+6.902
140.58%
jan 1, 2010
17.783
+5.97
50.54%
jan 1, 2011
14.629
-3.154
-17.74%
jan 1, 2012
16.949
+2.32
15.86%
jan 1, 2013
7.354
-9.595
-56.61%
jan 1, 2014
6.507
-0.847
-11.52%
jan 1, 2015
5.162
-1.345
-20.68%
Ranking of countries by current statistics by years


Comments: