29
/
en
AIzaSyAYiBZKx7MnpbEhh9jyipgxe19OcubqV5w
April 1, 2024
125200
Egypt, Arab Rep.
EGY
true
2
1
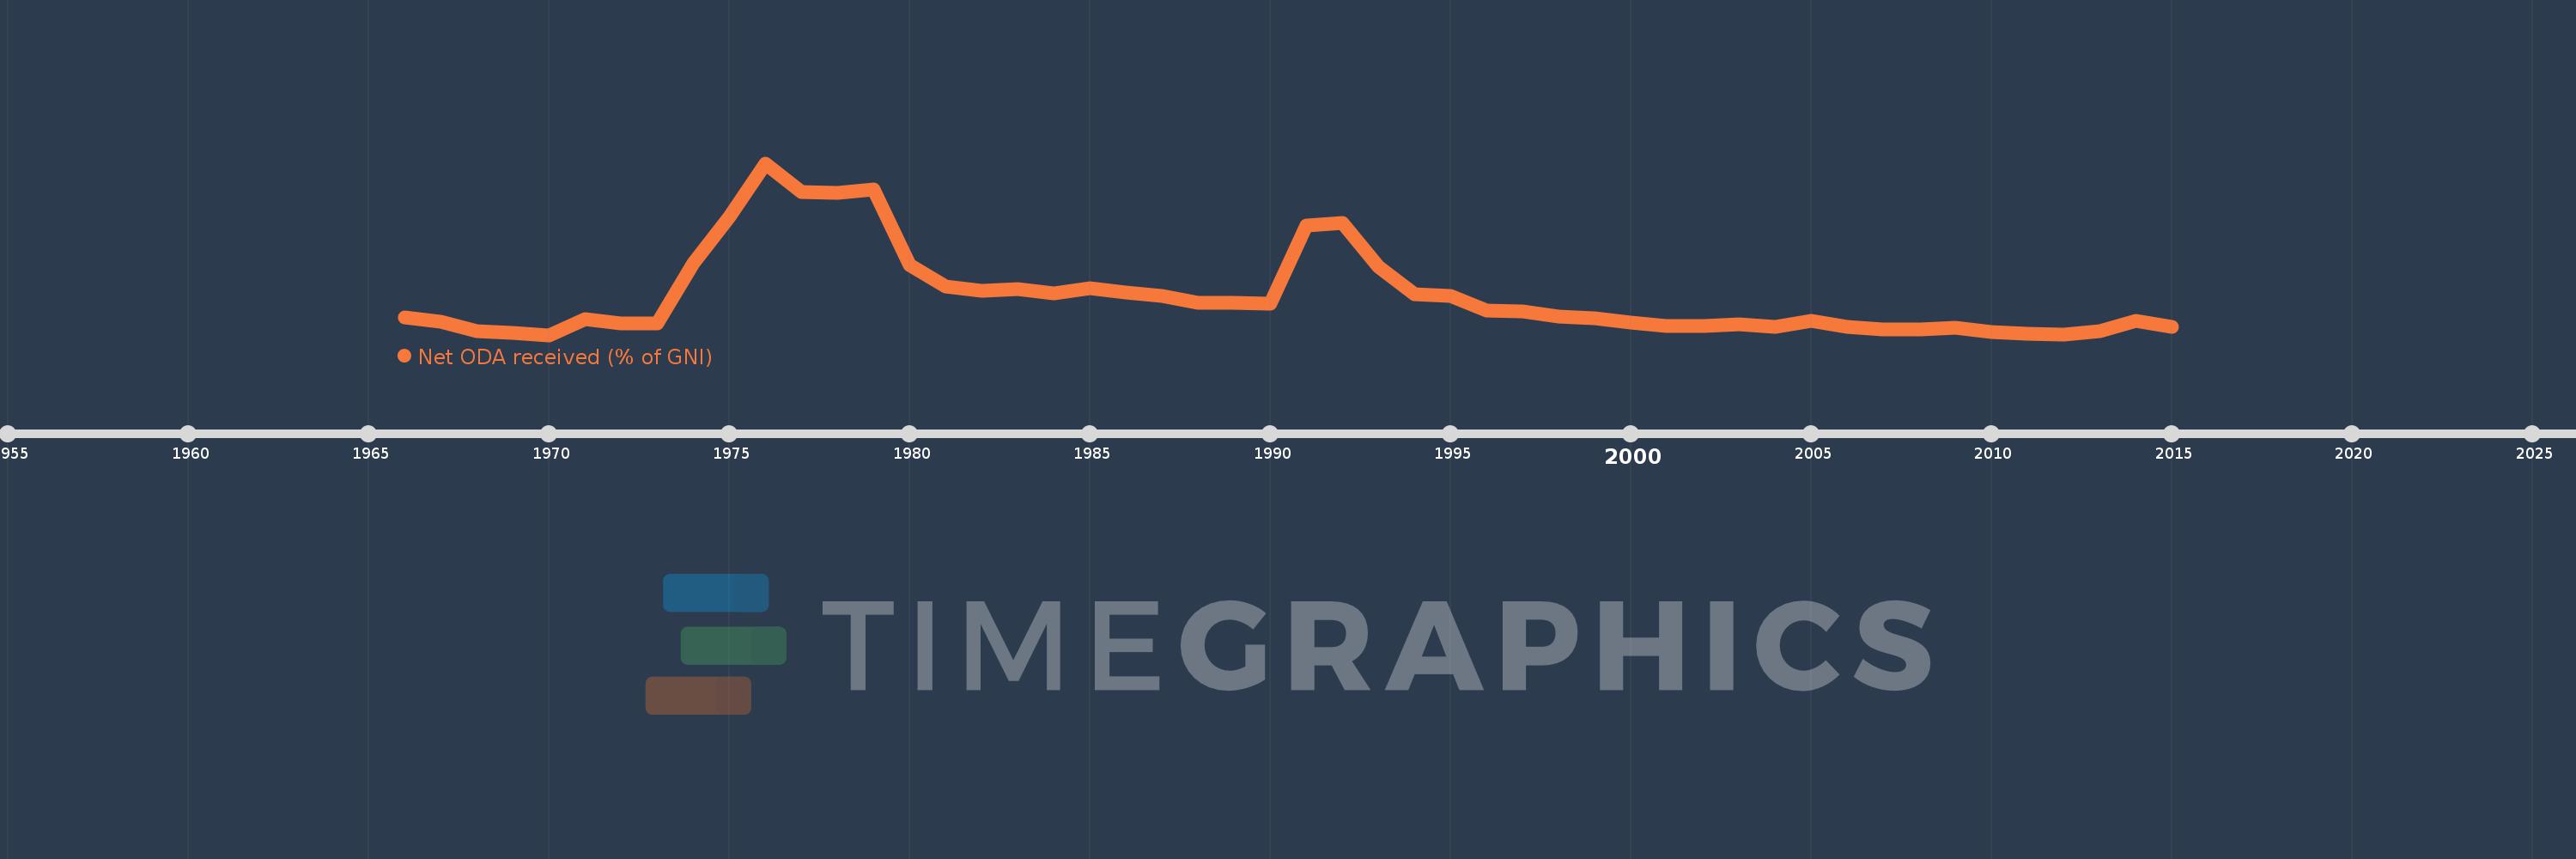
Net ODA received (% of GNI)
2015,2014,2013,2012,2011,2010,2009,2008,2007,2006,2005,2004,2003,2002,2001,2000,1999,1998,1997,1996,1995,1994,1993,1992,1991,1990,1989,1988,1987,1986,1985,1984,1983,1982,1981,1980,1979,1978,1977,1976,1975,1974,1973,1972,1971,1970,1969,1968,1967,1966
This statistics in other country:
AfghanistanAlbaniaAlgeriaAngolaAntigua and BarbudaArab WorldArgentinaArmeniaAzerbaijanBahamas, TheBahrainBangladeshBarbadosBelarusBelizeBeninBermudaBhutanBoliviaBosnia and HerzegovinaBotswanaBrazilBrunei DarussalamBurkina FasoBurundiCabo VerdeCambodiaCameroonCaribbean small statesCentral African RepublicCentral Europe and the BalticsChadChileChinaColombiaComorosCongo, Dem. Rep.Congo, Rep.Costa RicaCote d'IvoireCroatiaCubaCyprusDjiboutiDominicaDominican RepublicEast Asia & PacificEast Asia & Pacific (excluding high income)East Asia & Pacific (IDA & IBRD countries)EcuadorEgypt, Arab Rep.El SalvadorEquatorial GuineaEritreaEthiopiaEuro areaEurope & Central AsiaEurope & Central Asia (excluding high income)Europe & Central Asia (IDA & IBRD countries)European UnionFijiFragile and conflict affected situationsFrench PolynesiaGabonGambia, TheGeorgiaGhanaGrenadaGuatemalaGuineaGuinea-BissauGuyanaHaitiHeavily indebted poor countries (HIPC)High incomeHondurasHong Kong SAR, ChinaIBRD onlyIDA & IBRD totalIDA blendIDA onlyIDA totalIndiaIndonesiaIran, Islamic Rep.IraqIsraelJamaicaJordanKazakhstanKenyaKiribatiKorea, Rep.KosovoKuwaitKyrgyz RepublicLao PDRLatin America & Caribbean Latin America & Caribbean (excluding high income)Latin America & the Caribbean (IDA & IBRD countries)Least developed countries: UN classificationLebanonLesothoLiberiaLibyaLow & middle incomeLow incomeLower middle incomeMacao SAR, ChinaMacedonia, FYRMadagascarMalawiMalaysiaMaldivesMaliMaltaMarshall IslandsMauritaniaMauritiusMexicoMicronesia, Fed. Sts.Middle East & North AfricaMiddle East & North Africa (excluding high income)Middle East & North Africa (IDA & IBRD countries)Middle incomeMoldovaMongoliaMontenegroMoroccoMozambiqueMyanmarNamibiaNauruNepalNew CaledoniaNicaraguaNigerNigeriaNorth AmericaOECD membersOmanOther small statesPacific island small statesPakistanPalauPanamaPapua New GuineaParaguayPeruPhilippinesQatarRwandaSamoaSao Tome and PrincipeSaudi ArabiaSenegalSerbiaSeychellesSierra LeoneSingaporeSloveniaSmall statesSolomon IslandsSomaliaSouth AfricaSouth AsiaSouth Asia (IDA & IBRD)South SudanSri LankaSt. Kitts and NevisSt. LuciaSt. Vincent and the GrenadinesSub-Saharan Africa Sub-Saharan Africa (excluding high income)Sub-Saharan Africa (IDA & IBRD countries)SudanSurinameSwazilandSyrian Arab RepublicTajikistanTanzaniaThailandTimor-LesteTogoTongaTrinidad and TobagoTunisiaTurkeyTurkmenistanTuvaluUgandaUkraineUpper middle incomeUruguayUzbekistanVanuatuVenezuela, RBVietnamWest Bank and GazaWorldYemen, Rep.ZambiaZimbabwe Timeline:
This timeline shows a graph from 1966 to 2015 of Egypt, Arab Rep.. No data until 1965. Number of actual observations by date: 50.
Source name:
World Development Indicators
Source organization:
Development Assistance Committee of the Organisation for Economic Co-operation and Development, Geographical Distribution of Financial Flows to Developing Countries, Development Co-operation Report, and International Development Statistics database. Data are available online at: www.oecd.org/dac/stats/idsonline. World Bank GNI estimates are used for the denominator.
Categories, topics:
Aid Effectiveness, Economy & Growth, External Debt
Last updated:
apr 23, 2017
Indicators value changes by year
Maximum:
22.519
jan 1, 1976
At the date of observation
Value
Absolute change
Change from previous value
jan 1, 1966
2.42
+2.42
0.0%
jan 1, 1967
1.835
-0.586
-24.2%
jan 1, 1968
0.594
-1.241
-67.62%
jan 1, 1969
0.422
-0.172
-28.93%
jan 1, 1970
0.146
-0.277
-65.54%
jan 1, 1971
2.244
+2.098
1.44K%
jan 1, 1972
1.693
-0.551
-24.54%
jan 1, 1973
1.609
-0.084
-4.95%
jan 1, 1974
9.438
+7.829
486.45%
jan 1, 1975
15.572
+6.134
64.99%
jan 1, 1976
22.519
+6.947
44.61%
jan 1, 1977
18.757
-3.762
-16.71%
jan 1, 1978
18.635
-0.122
-0.65%
jan 1, 1979
19.062
+0.427
2.29%
jan 1, 1980
9.24
-9.821
-51.52%
jan 1, 1981
6.462
-2.778
-30.06%
jan 1, 1982
5.959
-0.503
-7.79%
jan 1, 1983
6.15
+0.191
3.21%
jan 1, 1984
5.535
-0.616
-10.01%
jan 1, 1985
6.195
+0.66
11.93%
jan 1, 1986
5.677
-0.518
-8.36%
jan 1, 1987
5.214
-0.463
-8.16%
jan 1, 1988
4.311
-0.903
-17.32%
jan 1, 1989
4.318
+0.007
0.17%
jan 1, 1990
4.199
-0.119
-2.77%
jan 1, 1991
14.413
+10.214
243.26%
jan 1, 1992
14.78
+0.367
2.55%
jan 1, 1993
9.011
-5.769
-39.03%
jan 1, 1994
5.406
-3.606
-40.01%
jan 1, 1995
5.205
-0.201
-3.71%
jan 1, 1996
3.366
-1.839
-35.32%
jan 1, 1997
3.218
-0.148
-4.39%
jan 1, 1998
2.539
-0.679
-21.1%
jan 1, 1999
2.29
-0.249
-9.82%
jan 1, 2000
1.772
-0.518
-22.63%
jan 1, 2001
1.361
-0.411
-23.21%
jan 1, 2002
1.325
-0.035
-2.59%
jan 1, 2003
1.499
+0.174
13.09%
jan 1, 2004
1.232
-0.267
-17.81%
jan 1, 2005
1.979
+0.747
60.66%
jan 1, 2006
1.159
-0.82
-41.45%
jan 1, 2007
0.832
-0.327
-28.21%
jan 1, 2008
0.86
+0.028
3.41%
jan 1, 2009
1.061
+0.201
23.34%
jan 1, 2010
0.529
-0.533
-50.18%
jan 1, 2011
0.275
-0.254
-48.06%
jan 1, 2012
0.181
-0.094
-34.06%
jan 1, 2013
0.669
+0.488
269.7%
jan 1, 2014
1.977
+1.308
195.31%
jan 1, 2015
1.201
-0.776
-39.27%
Ranking of countries by current statistics by years


Comments: