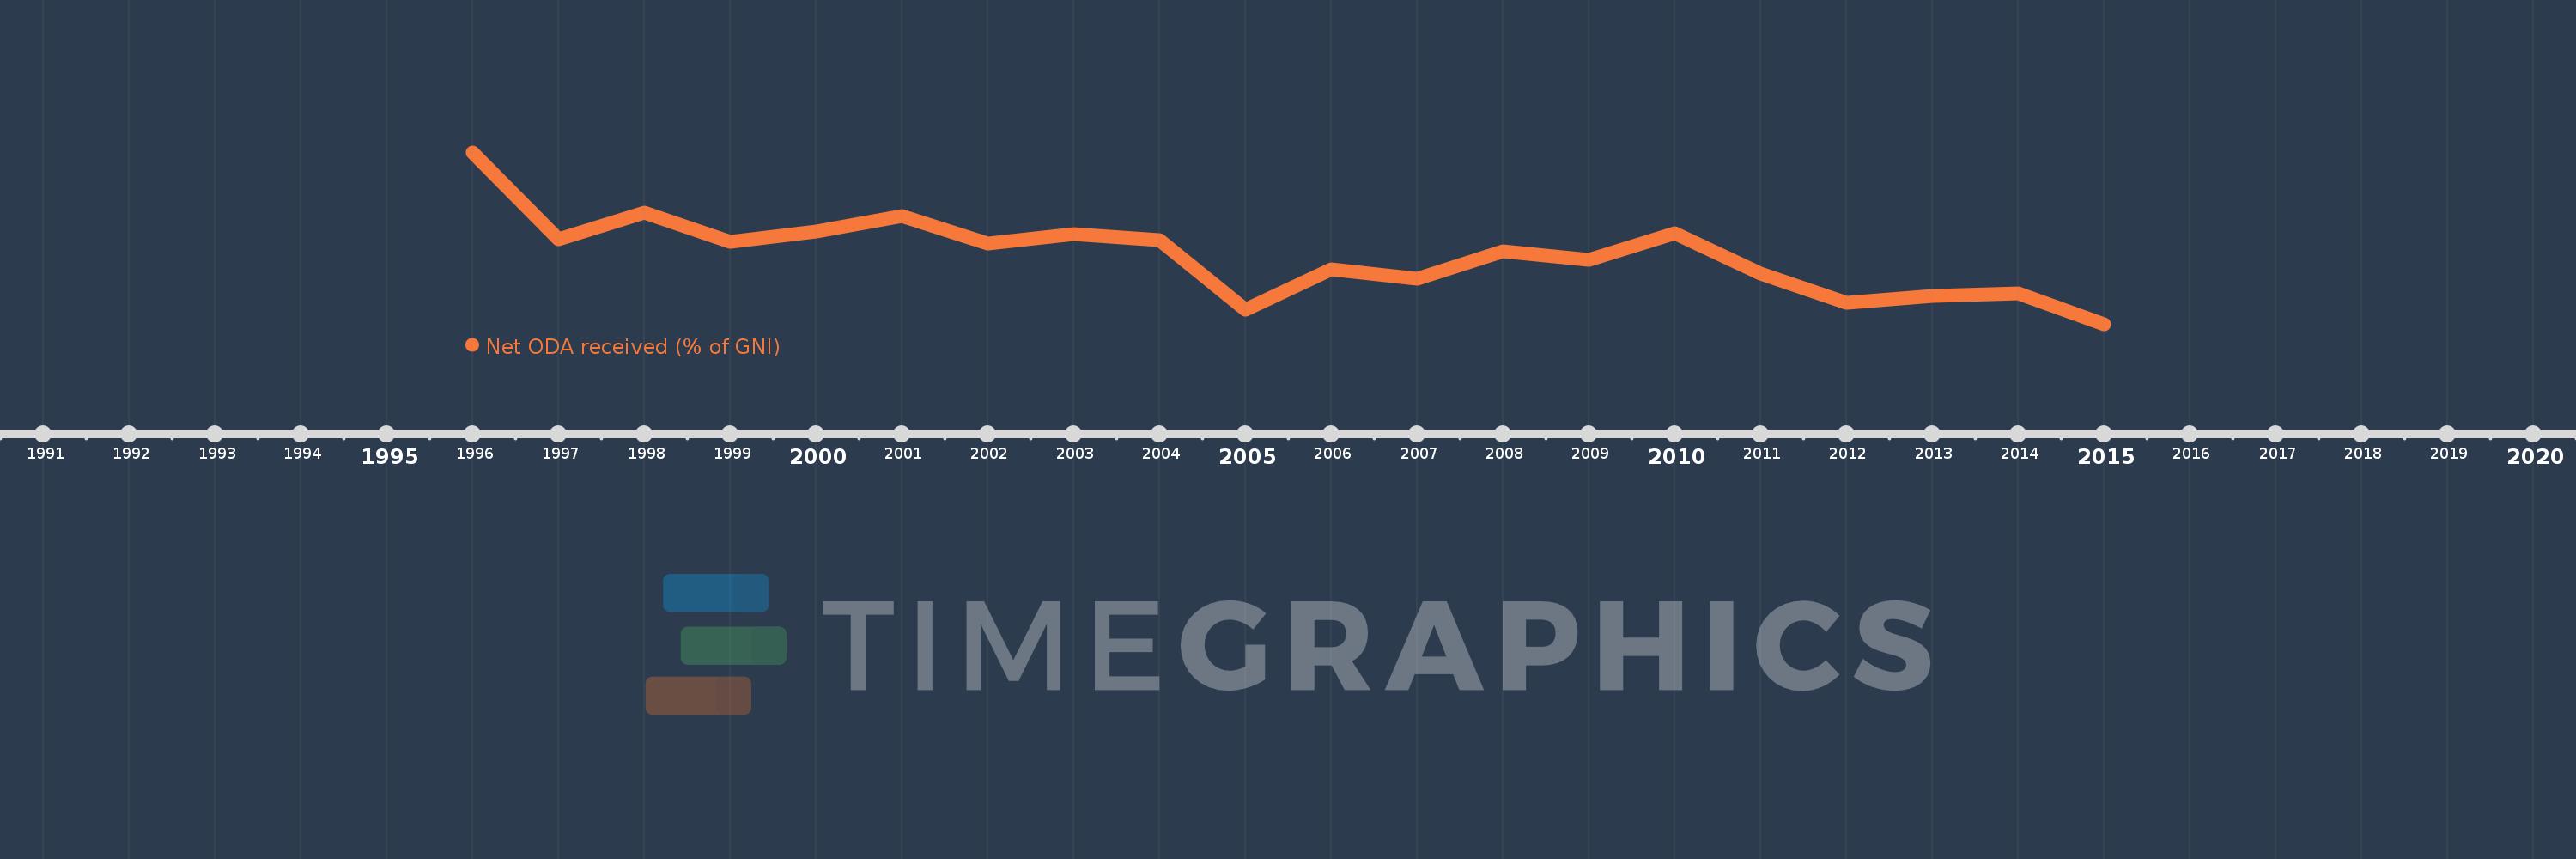
This timeline shows a graph from 1996 to 2015 of Paraguay. No data until 1995. Number of actual observations by date: 20.
Source name:
World Development Indicators
Source organization:
Development Assistance Committee of the Organisation for Economic Co-operation and Development, Geographical Distribution of Financial Flows to Developing Countries, Development Co-operation Report, and International Development Statistics database. Data are available online at: www.oecd.org/dac/stats/idsonline. World Bank GNI estimates are used for the denominator.
Categories, topics:
Aid Effectiveness, Economy & Growth, External Debt
Last updated:
apr 23, 2017
Indicators value changes by year
Meaning:
0.809
Minimum:
0.205
jan 1, 2015
Maximum:
1.706
jan 1, 1996
At the date of observation
Value
Absolute change
Change from the previous value
jan 1, 1996
1.706
+1.706
0.0%
jan 1, 1997
0.95
-0.756
-44.31%
jan 1, 1998
1.183
+0.232
24.45%
jan 1, 1999
0.926
-0.256
-21.68%
jan 1, 2000
1.016
+0.089
9.64%
jan 1, 2001
1.151
+0.135
13.32%
jan 1, 2002
0.91
-0.241
-20.91%
jan 1, 2003
0.991
+0.081
8.89%
jan 1, 2004
0.942
-0.049
-4.98%
jan 1, 2005
0.332
-0.61
-64.71%
jan 1, 2006
0.688
+0.356
107.04%
jan 1, 2007
0.6
-0.088
-12.78%
jan 1, 2008
0.843
+0.243
40.51%
jan 1, 2009
0.768
-0.075
-8.88%
jan 1, 2010
1.003
+0.235
30.57%
jan 1, 2011
0.645
-0.358
-35.71%
jan 1, 2012
0.39
-0.255
-39.6%
jan 1, 2013
0.449
+0.059
15.15%
jan 1, 2014
0.471
+0.022
5.01%
jan 1, 2015
0.205
-0.266
-56.47%
Ranking of countries by current statistics by years
