29
/
en
AIzaSyAYiBZKx7MnpbEhh9jyipgxe19OcubqV5w
April 1, 2024
29352
East Asia & Pacific (IDA & IBRD countries)
TEA
false
2
1
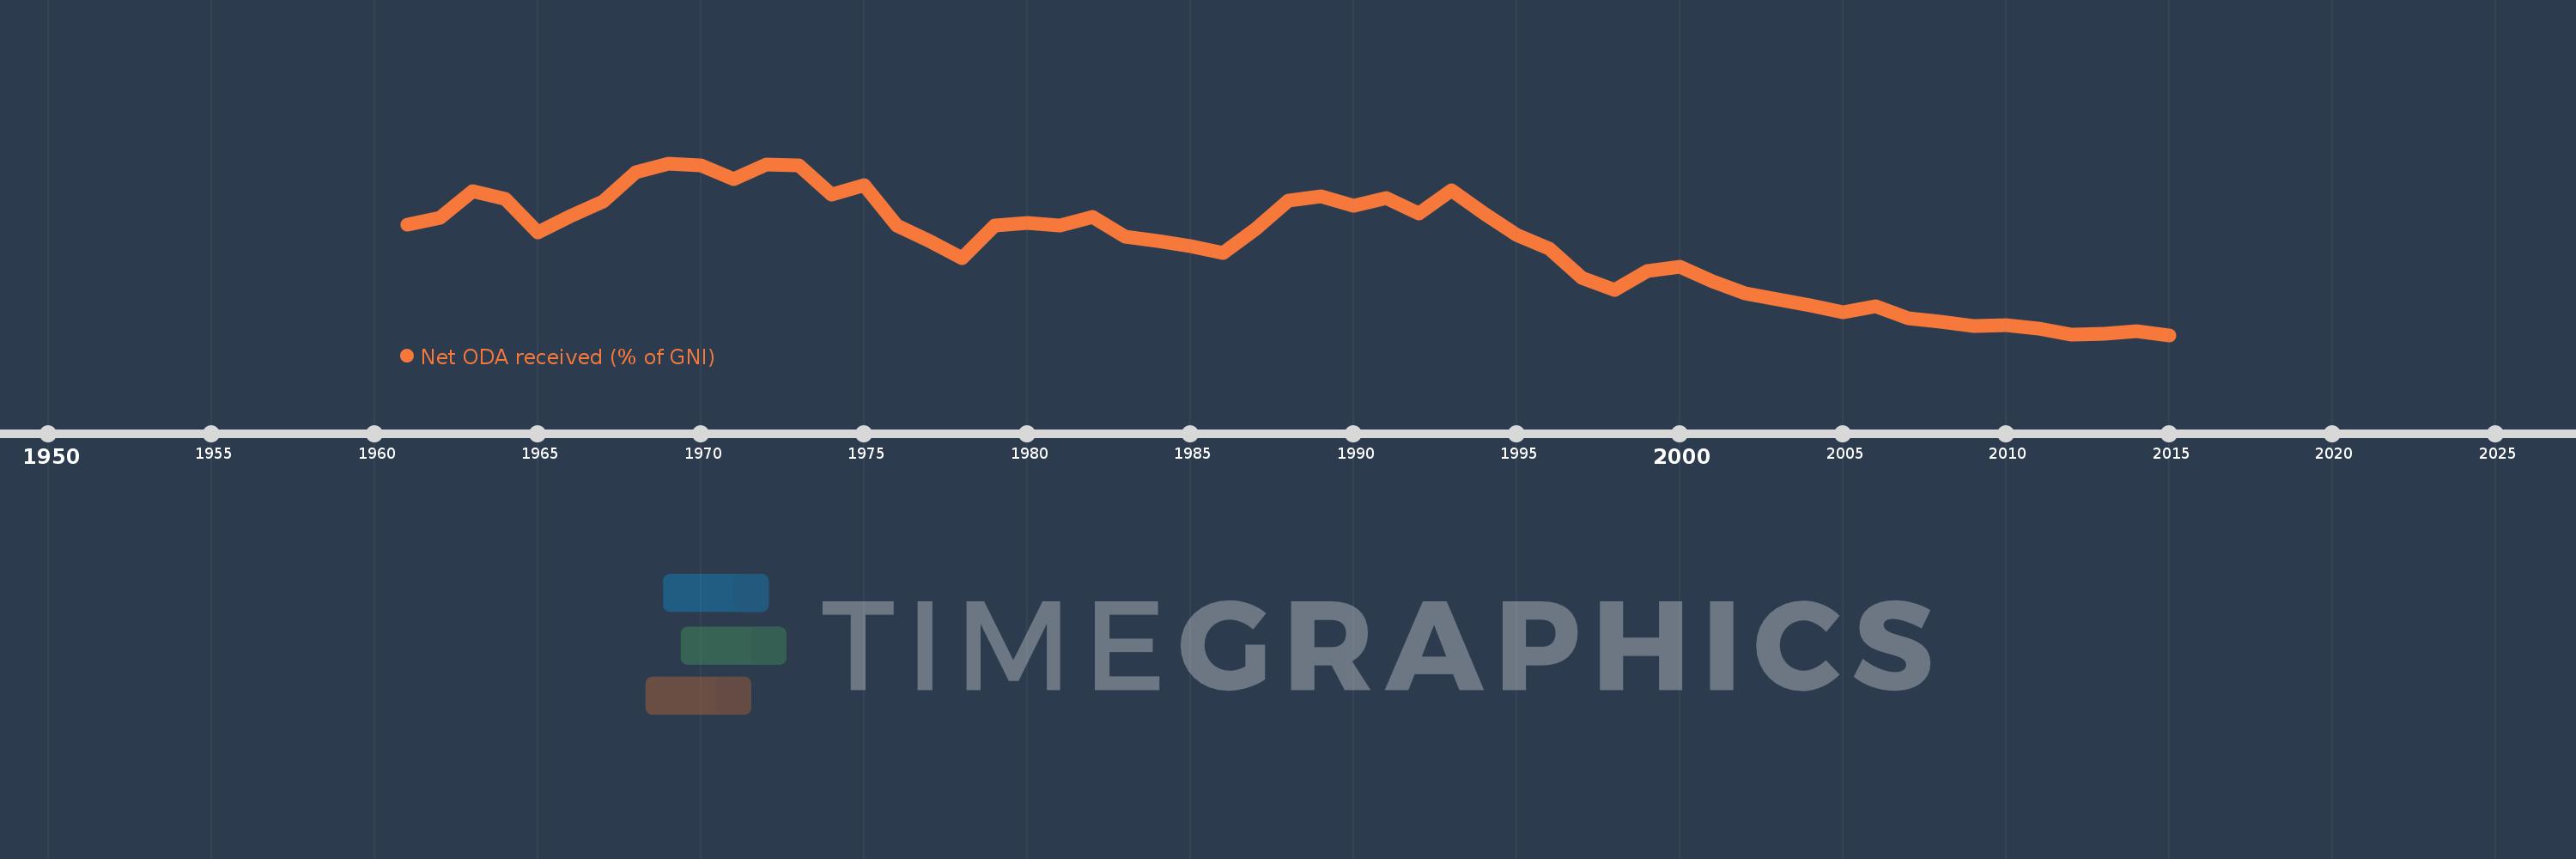
Net ODA received (% of GNI)
2015,2014,2013,2012,2011,2010,2009,2008,2007,2006,2005,2004,2003,2002,2001,2000,1999,1998,1997,1996,1995,1994,1993,1992,1991,1990,1989,1988,1987,1986,1985,1984,1983,1982,1981,1980,1979,1978,1977,1976,1975,1974,1973,1972,1971,1970,1969,1968,1967,1966,1965,1964,1963,1962,1961
This statistics in other country:
AfghanistanAlbaniaAlgeriaAngolaAntigua and BarbudaArab WorldArgentinaArmeniaAzerbaijanBahamas, TheBahrainBangladeshBarbadosBelarusBelizeBeninBermudaBhutanBoliviaBosnia and HerzegovinaBotswanaBrazilBrunei DarussalamBurkina FasoBurundiCabo VerdeCambodiaCameroonCaribbean small statesCentral African RepublicCentral Europe and the BalticsChadChileChinaColombiaComorosCongo, Dem. Rep.Congo, Rep.Costa RicaCote d'IvoireCroatiaCubaCyprusDjiboutiDominicaDominican RepublicEast Asia & PacificEast Asia & Pacific (excluding high income)East Asia & Pacific (IDA & IBRD countries)EcuadorEgypt, Arab Rep.El SalvadorEquatorial GuineaEritreaEthiopiaEuro areaEurope & Central AsiaEurope & Central Asia (excluding high income)Europe & Central Asia (IDA & IBRD countries)European UnionFijiFragile and conflict affected situationsFrench PolynesiaGabonGambia, TheGeorgiaGhanaGrenadaGuatemalaGuineaGuinea-BissauGuyanaHaitiHeavily indebted poor countries (HIPC)High incomeHondurasHong Kong SAR, ChinaIBRD onlyIDA & IBRD totalIDA blendIDA onlyIDA totalIndiaIndonesiaIran, Islamic Rep.IraqIsraelJamaicaJordanKazakhstanKenyaKiribatiKorea, Rep.KosovoKuwaitKyrgyz RepublicLao PDRLatin America & Caribbean Latin America & Caribbean (excluding high income)Latin America & the Caribbean (IDA & IBRD countries)Least developed countries: UN classificationLebanonLesothoLiberiaLibyaLow & middle incomeLow incomeLower middle incomeMacao SAR, ChinaMacedonia, FYRMadagascarMalawiMalaysiaMaldivesMaliMaltaMarshall IslandsMauritaniaMauritiusMexicoMicronesia, Fed. Sts.Middle East & North AfricaMiddle East & North Africa (excluding high income)Middle East & North Africa (IDA & IBRD countries)Middle incomeMoldovaMongoliaMontenegroMoroccoMozambiqueMyanmarNamibiaNauruNepalNew CaledoniaNicaraguaNigerNigeriaNorth AmericaOECD membersOmanOther small statesPacific island small statesPakistanPalauPanamaPapua New GuineaParaguayPeruPhilippinesQatarRwandaSamoaSao Tome and PrincipeSaudi ArabiaSenegalSerbiaSeychellesSierra LeoneSingaporeSloveniaSmall statesSolomon IslandsSomaliaSouth AfricaSouth AsiaSouth Asia (IDA & IBRD)South SudanSri LankaSt. Kitts and NevisSt. LuciaSt. Vincent and the GrenadinesSub-Saharan Africa Sub-Saharan Africa (excluding high income)Sub-Saharan Africa (IDA & IBRD countries)SudanSurinameSwazilandSyrian Arab RepublicTajikistanTanzaniaThailandTimor-LesteTogoTongaTrinidad and TobagoTunisiaTurkeyTurkmenistanTuvaluUgandaUkraineUpper middle incomeUruguayUzbekistanVanuatuVenezuela, RBVietnamWest Bank and GazaWorldYemen, Rep.ZambiaZimbabwe Timeline:
This timeline shows a graph from 1961 to 2015 of East Asia & Pacific (IDA & IBRD countries). No data until 1960. Number of actual observations by date: 55.
Source name:
World Development Indicators
Source organization:
Development Assistance Committee of the Organisation for Economic Co-operation and Development, Geographical Distribution of Financial Flows to Developing Countries, Development Co-operation Report, and International Development Statistics database. Data are available online at: www.oecd.org/dac/stats/idsonline. World Bank GNI estimates are used for the denominator.
Categories, topics:
Aid Effectiveness, Economy & Growth, External Debt
Last updated:
apr 23, 2017
Indicators value changes by year
At the date of observation
Value
Absolute change
Change from previous value
jan 1, 1961
0.931
+0.931
0.0%
jan 1, 1962
0.984
+0.052
5.62%
jan 1, 1963
1.191
+0.208
21.12%
jan 1, 1964
1.133
-0.058
-4.87%
jan 1, 1965
0.87
-0.263
-23.22%
jan 1, 1966
0.999
+0.129
14.85%
jan 1, 1967
1.114
+0.115
11.51%
jan 1, 1968
1.338
+0.224
20.09%
jan 1, 1969
1.411
+0.073
5.42%
jan 1, 1970
1.394
-0.016
-1.16%
jan 1, 1971
1.287
-0.108
-7.72%
jan 1, 1972
1.401
+0.115
8.91%
jan 1, 1973
1.394
-0.008
-0.54%
jan 1, 1974
1.169
-0.225
-16.16%
jan 1, 1975
1.239
+0.071
6.06%
jan 1, 1976
0.925
-0.314
-25.35%
jan 1, 1977
0.801
-0.125
-13.48%
jan 1, 1978
0.671
-0.13
-16.22%
jan 1, 1979
0.927
+0.257
38.25%
jan 1, 1980
0.945
+0.018
1.92%
jan 1, 1981
0.927
-0.018
-1.91%
jan 1, 1982
0.992
+0.065
7.05%
jan 1, 1983
0.836
-0.157
-15.79%
jan 1, 1984
0.801
-0.034
-4.09%
jan 1, 1985
0.76
-0.042
-5.18%
jan 1, 1986
0.71
-0.05
-6.56%
jan 1, 1987
0.9
+0.19
26.79%
jan 1, 1988
1.119
+0.219
24.27%
jan 1, 1989
1.154
+0.035
3.13%
jan 1, 1990
1.077
-0.077
-6.64%
jan 1, 1991
1.14
+0.063
5.84%
jan 1, 1992
1.017
-0.123
-10.8%
jan 1, 1993
1.198
+0.181
17.82%
jan 1, 1994
1.021
-0.177
-14.77%
jan 1, 1995
0.853
-0.169
-16.53%
jan 1, 1996
0.745
-0.107
-12.59%
jan 1, 1997
0.513
-0.233
-31.21%
jan 1, 1998
0.42
-0.093
-18.07%
jan 1, 1999
0.568
+0.148
35.26%
jan 1, 2000
0.603
+0.035
6.17%
jan 1, 2001
0.484
-0.119
-19.68%
jan 1, 2002
0.396
-0.088
-18.25%
jan 1, 2003
0.346
-0.051
-12.76%
jan 1, 2004
0.296
-0.049
-14.25%
jan 1, 2005
0.244
-0.052
-17.55%
jan 1, 2006
0.29
+0.046
18.89%
jan 1, 2007
0.197
-0.093
-32.07%
jan 1, 2008
0.172
-0.025
-12.58%
jan 1, 2009
0.135
-0.038
-21.81%
jan 1, 2010
0.147
+0.012
8.93%
jan 1, 2011
0.115
-0.032
-21.94%
jan 1, 2012
0.073
-0.041
-35.99%
jan 1, 2013
0.075
+0.002
2.32%
jan 1, 2014
0.095
+0.02
26.02%
jan 1, 2015
0.067
-0.027
-28.8%
Ranking of countries by current statistics by years


Comments: