29
/
en
AIzaSyAYiBZKx7MnpbEhh9jyipgxe19OcubqV5w
April 1, 2024
35225
Heavily indebted poor countries (HIPC)
HPC
false
2
1
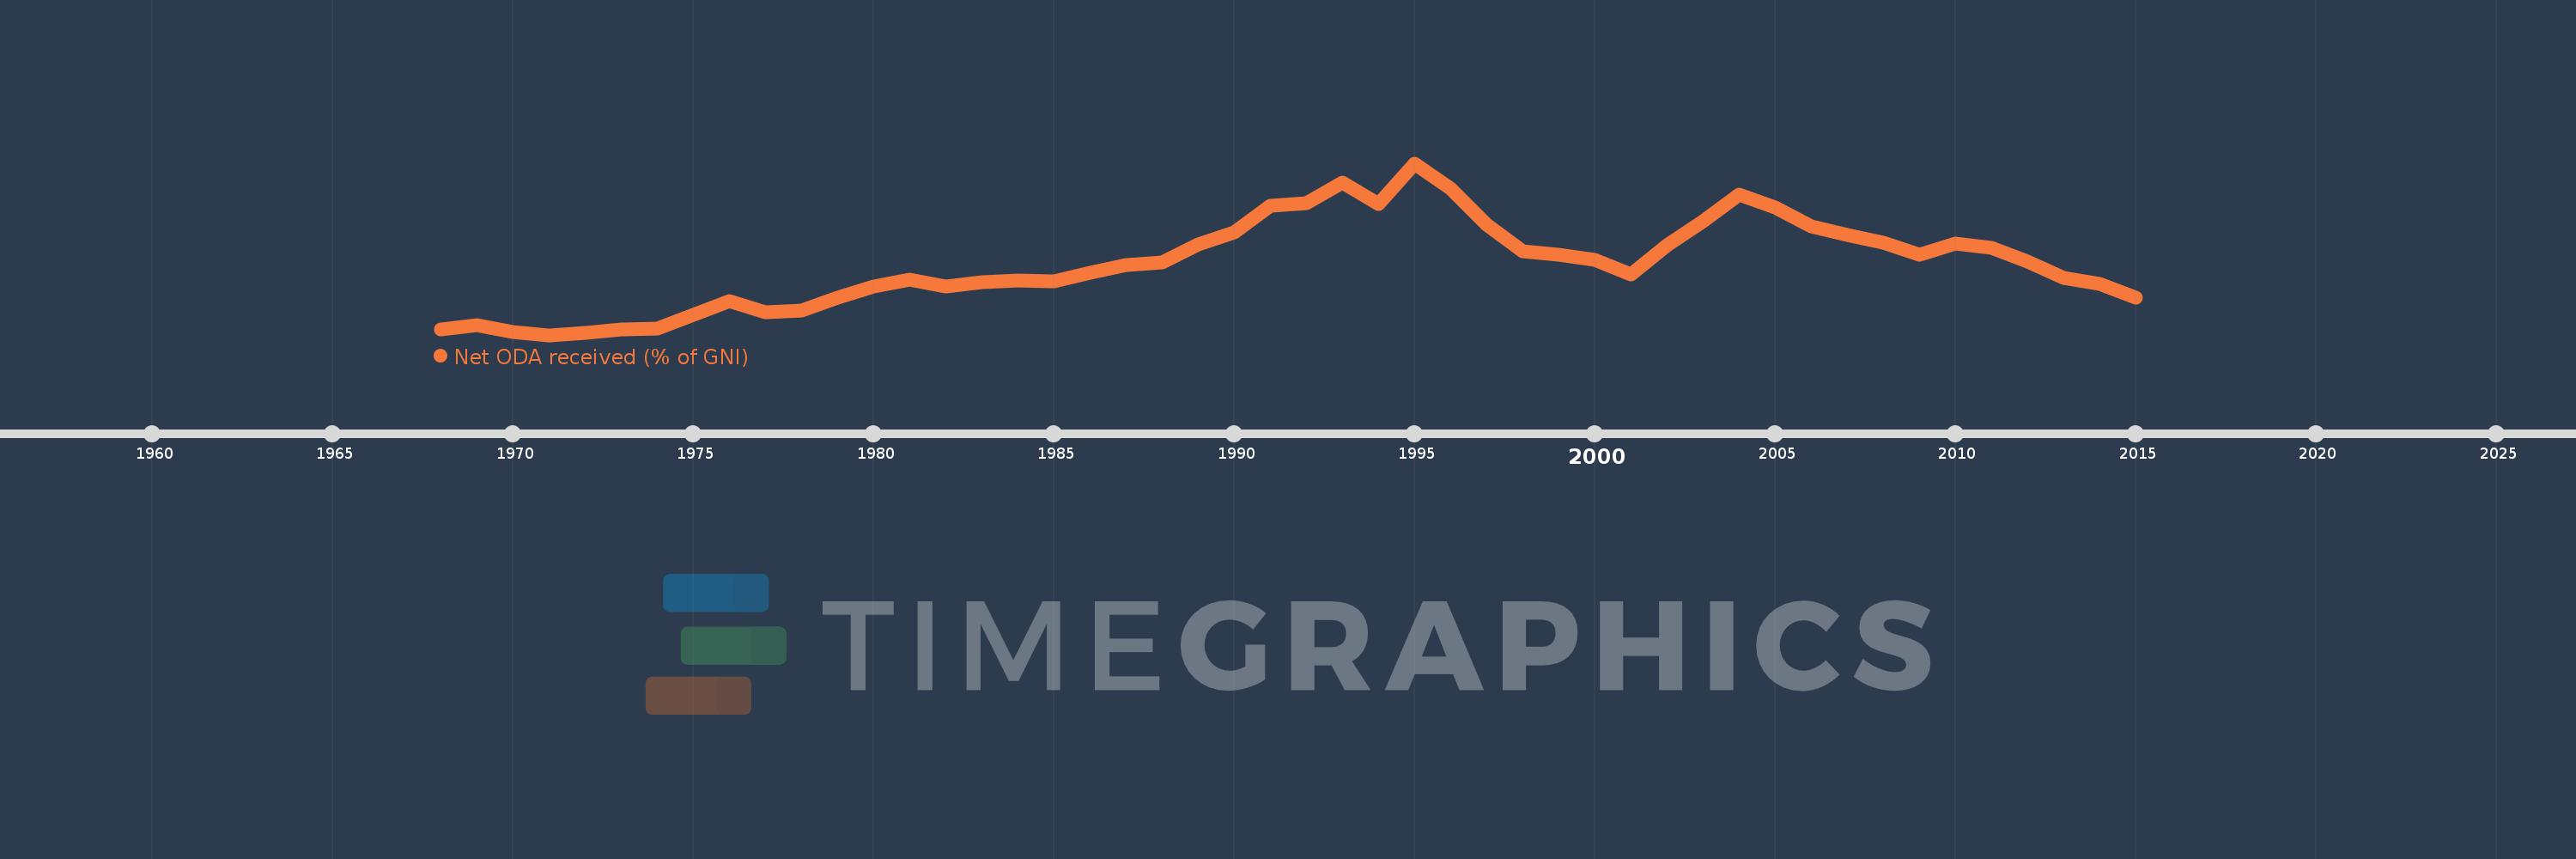
Net ODA received (% of GNI)
2015,2014,2013,2012,2011,2010,2009,2008,2007,2006,2005,2004,2003,2002,2001,2000,1999,1998,1997,1996,1995,1994,1993,1992,1991,1990,1989,1988,1987,1986,1985,1984,1983,1982,1981,1980,1979,1978,1977,1976,1975,1974,1973,1972,1971,1970,1969,1968
This statistics in other country:
AfghanistanAlbaniaAlgeriaAngolaAntigua and BarbudaArab WorldArgentinaArmeniaAzerbaijanBahamas, TheBahrainBangladeshBarbadosBelarusBelizeBeninBermudaBhutanBoliviaBosnia and HerzegovinaBotswanaBrazilBrunei DarussalamBurkina FasoBurundiCabo VerdeCambodiaCameroonCaribbean small statesCentral African RepublicCentral Europe and the BalticsChadChileChinaColombiaComorosCongo, Dem. Rep.Congo, Rep.Costa RicaCote d'IvoireCroatiaCubaCyprusDjiboutiDominicaDominican RepublicEast Asia & PacificEast Asia & Pacific (excluding high income)East Asia & Pacific (IDA & IBRD countries)EcuadorEgypt, Arab Rep.El SalvadorEquatorial GuineaEritreaEthiopiaEuro areaEurope & Central AsiaEurope & Central Asia (excluding high income)Europe & Central Asia (IDA & IBRD countries)European UnionFijiFragile and conflict affected situationsFrench PolynesiaGabonGambia, TheGeorgiaGhanaGrenadaGuatemalaGuineaGuinea-BissauGuyanaHaitiHeavily indebted poor countries (HIPC)High incomeHondurasHong Kong SAR, ChinaIBRD onlyIDA & IBRD totalIDA blendIDA onlyIDA totalIndiaIndonesiaIran, Islamic Rep.IraqIsraelJamaicaJordanKazakhstanKenyaKiribatiKorea, Rep.KosovoKuwaitKyrgyz RepublicLao PDRLatin America & Caribbean Latin America & Caribbean (excluding high income)Latin America & the Caribbean (IDA & IBRD countries)Least developed countries: UN classificationLebanonLesothoLiberiaLibyaLow & middle incomeLow incomeLower middle incomeMacao SAR, ChinaMacedonia, FYRMadagascarMalawiMalaysiaMaldivesMaliMaltaMarshall IslandsMauritaniaMauritiusMexicoMicronesia, Fed. Sts.Middle East & North AfricaMiddle East & North Africa (excluding high income)Middle East & North Africa (IDA & IBRD countries)Middle incomeMoldovaMongoliaMontenegroMoroccoMozambiqueMyanmarNamibiaNauruNepalNew CaledoniaNicaraguaNigerNigeriaNorth AmericaOECD membersOmanOther small statesPacific island small statesPakistanPalauPanamaPapua New GuineaParaguayPeruPhilippinesQatarRwandaSamoaSao Tome and PrincipeSaudi ArabiaSenegalSerbiaSeychellesSierra LeoneSingaporeSloveniaSmall statesSolomon IslandsSomaliaSouth AfricaSouth AsiaSouth Asia (IDA & IBRD)South SudanSri LankaSt. Kitts and NevisSt. LuciaSt. Vincent and the GrenadinesSub-Saharan Africa Sub-Saharan Africa (excluding high income)Sub-Saharan Africa (IDA & IBRD countries)SudanSurinameSwazilandSyrian Arab RepublicTajikistanTanzaniaThailandTimor-LesteTogoTongaTrinidad and TobagoTunisiaTurkeyTurkmenistanTuvaluUgandaUkraineUpper middle incomeUruguayUzbekistanVanuatuVenezuela, RBVietnamWest Bank and GazaWorldYemen, Rep.ZambiaZimbabwe Timeline:
This timeline shows a graph from 1968 to 2015 of Heavily indebted poor countries (HIPC). No data until 1967. Number of actual observations by date: 48.
Source name:
World Development Indicators
Source organization:
Development Assistance Committee of the Organisation for Economic Co-operation and Development, Geographical Distribution of Financial Flows to Developing Countries, Development Co-operation Report, and International Development Statistics database. Data are available online at: www.oecd.org/dac/stats/idsonline. World Bank GNI estimates are used for the denominator.
Categories, topics:
Aid Effectiveness, Economy & Growth, External Debt
Last updated:
apr 23, 2017
Indicators value changes by year
Maximum:
16.512
jan 1, 1995
At the date of observation
Value
Absolute change
Change from previous value
jan 1, 1968
3.807
+3.807
0.0%
jan 1, 1969
4.092
+0.285
7.48%
jan 1, 1970
3.568
-0.524
-12.81%
jan 1, 1971
3.356
-0.212
-5.94%
jan 1, 1972
3.546
+0.191
5.68%
jan 1, 1973
3.759
+0.212
5.99%
jan 1, 1974
3.831
+0.072
1.93%
jan 1, 1975
4.927
+1.096
28.61%
jan 1, 1976
5.935
+1.008
20.46%
jan 1, 1977
5.101
-0.834
-14.05%
jan 1, 1978
5.228
+0.127
2.49%
jan 1, 1979
6.249
+1.021
19.53%
jan 1, 1980
7.042
+0.793
12.69%
jan 1, 1981
7.576
+0.534
7.58%
jan 1, 1982
7.049
-0.527
-6.96%
jan 1, 1983
7.385
+0.337
4.78%
jan 1, 1984
7.514
+0.129
1.74%
jan 1, 1985
7.458
-0.056
-0.74%
jan 1, 1986
8.116
+0.658
8.82%
jan 1, 1987
8.742
+0.626
7.71%
jan 1, 1988
8.893
+0.151
1.73%
jan 1, 1989
10.327
+1.434
16.13%
jan 1, 1990
11.211
+0.883
8.55%
jan 1, 1991
13.26
+2.049
18.28%
jan 1, 1992
13.468
+0.208
1.57%
jan 1, 1993
15.039
+1.571
11.67%
jan 1, 1994
13.373
-1.666
-11.08%
jan 1, 1995
16.512
+3.139
23.47%
jan 1, 1996
14.601
-1.911
-11.57%
jan 1, 1997
11.837
-2.765
-18.93%
jan 1, 1998
9.745
-2.092
-17.67%
jan 1, 1999
9.475
-0.27
-2.77%
jan 1, 2000
9.088
-0.387
-4.08%
jan 1, 2001
7.973
-1.115
-12.27%
jan 1, 2002
10.216
+2.243
28.13%
jan 1, 2003
12.074
+1.858
18.19%
jan 1, 2004
14.125
+2.052
16.99%
jan 1, 2005
13.099
-1.027
-7.27%
jan 1, 2006
11.693
-1.405
-10.73%
jan 1, 2007
11.049
-0.645
-5.51%
jan 1, 2008
10.408
-0.64
-5.79%
jan 1, 2009
9.475
-0.933
-8.97%
jan 1, 2010
10.329
+0.854
9.02%
jan 1, 2011
10.061
-0.269
-2.6%
jan 1, 2012
9.003
-1.058
-10.51%
jan 1, 2013
7.755
-1.248
-13.87%
jan 1, 2014
7.28
-0.474
-6.11%
jan 1, 2015
6.236
-1.044
-14.34%
Ranking of countries by current statistics by years


Comments: