29
/
en
AIzaSyAYiBZKx7MnpbEhh9jyipgxe19OcubqV5w
April 1, 2024
69087
Antigua and Barbuda
ATG
true
2
1
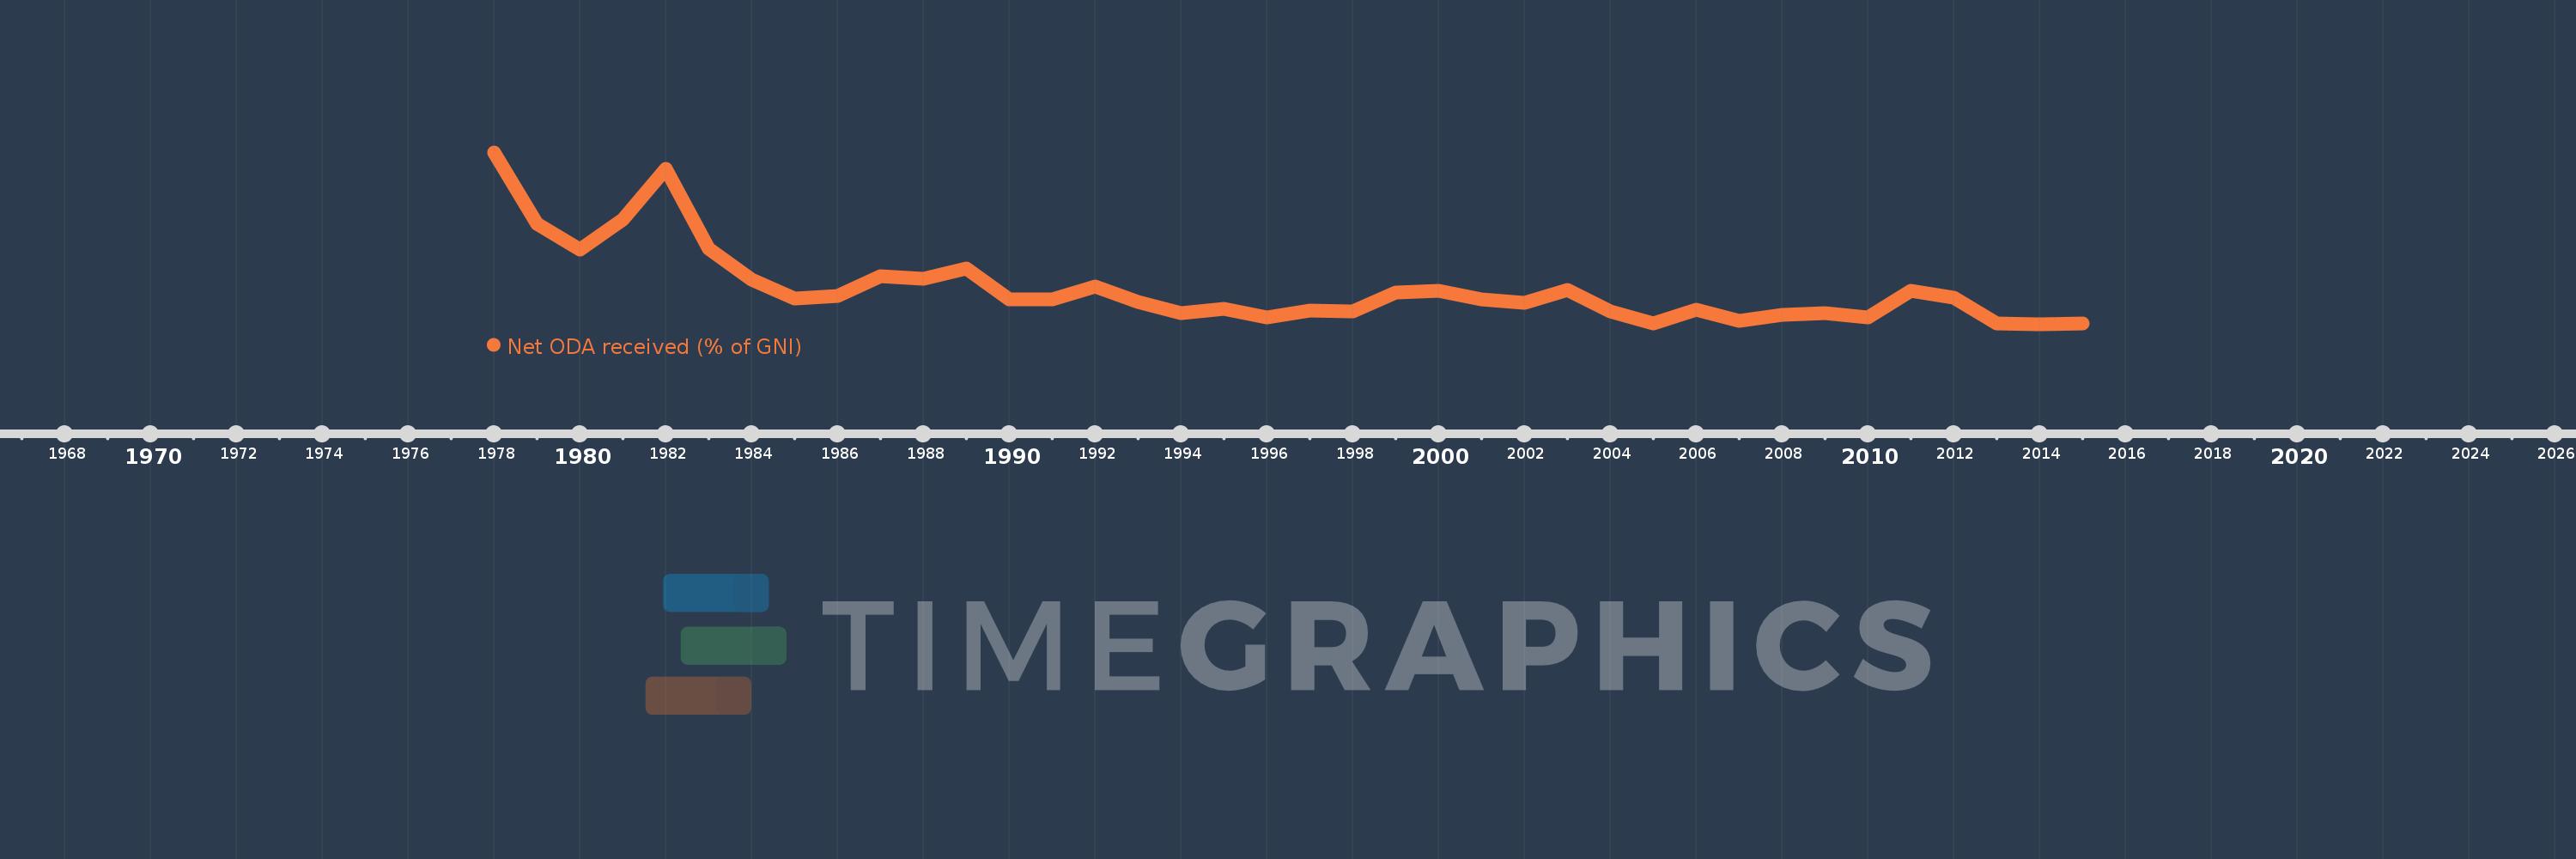
Net ODA received (% of GNI)
2015,2014,2013,2012,2011,2010,2009,2008,2007,2006,2005,2004,2003,2002,2001,2000,1999,1998,1997,1996,1995,1994,1993,1992,1991,1990,1989,1988,1987,1986,1985,1984,1983,1982,1981,1980,1979,1978
This statistics in other country:
AfghanistanAlbaniaAlgeriaAngolaAntigua and BarbudaArab WorldArgentinaArmeniaAzerbaijanBahamas, TheBahrainBangladeshBarbadosBelarusBelizeBeninBermudaBhutanBoliviaBosnia and HerzegovinaBotswanaBrazilBrunei DarussalamBurkina FasoBurundiCabo VerdeCambodiaCameroonCaribbean small statesCentral African RepublicCentral Europe and the BalticsChadChileChinaColombiaComorosCongo, Dem. Rep.Congo, Rep.Costa RicaCote d'IvoireCroatiaCubaCyprusDjiboutiDominicaDominican RepublicEast Asia & PacificEast Asia & Pacific (excluding high income)East Asia & Pacific (IDA & IBRD countries)EcuadorEgypt, Arab Rep.El SalvadorEquatorial GuineaEritreaEthiopiaEuro areaEurope & Central AsiaEurope & Central Asia (excluding high income)Europe & Central Asia (IDA & IBRD countries)European UnionFijiFragile and conflict affected situationsFrench PolynesiaGabonGambia, TheGeorgiaGhanaGrenadaGuatemalaGuineaGuinea-BissauGuyanaHaitiHeavily indebted poor countries (HIPC)High incomeHondurasHong Kong SAR, ChinaIBRD onlyIDA & IBRD totalIDA blendIDA onlyIDA totalIndiaIndonesiaIran, Islamic Rep.IraqIsraelJamaicaJordanKazakhstanKenyaKiribatiKorea, Rep.KosovoKuwaitKyrgyz RepublicLao PDRLatin America & Caribbean Latin America & Caribbean (excluding high income)Latin America & the Caribbean (IDA & IBRD countries)Least developed countries: UN classificationLebanonLesothoLiberiaLibyaLow & middle incomeLow incomeLower middle incomeMacao SAR, ChinaMacedonia, FYRMadagascarMalawiMalaysiaMaldivesMaliMaltaMarshall IslandsMauritaniaMauritiusMexicoMicronesia, Fed. Sts.Middle East & North AfricaMiddle East & North Africa (excluding high income)Middle East & North Africa (IDA & IBRD countries)Middle incomeMoldovaMongoliaMontenegroMoroccoMozambiqueMyanmarNamibiaNauruNepalNew CaledoniaNicaraguaNigerNigeriaNorth AmericaOECD membersOmanOther small statesPacific island small statesPakistanPalauPanamaPapua New GuineaParaguayPeruPhilippinesQatarRwandaSamoaSao Tome and PrincipeSaudi ArabiaSenegalSerbiaSeychellesSierra LeoneSingaporeSloveniaSmall statesSolomon IslandsSomaliaSouth AfricaSouth AsiaSouth Asia (IDA & IBRD)South SudanSri LankaSt. Kitts and NevisSt. LuciaSt. Vincent and the GrenadinesSub-Saharan Africa Sub-Saharan Africa (excluding high income)Sub-Saharan Africa (IDA & IBRD countries)SudanSurinameSwazilandSyrian Arab RepublicTajikistanTanzaniaThailandTimor-LesteTogoTongaTrinidad and TobagoTunisiaTurkeyTurkmenistanTuvaluUgandaUkraineUpper middle incomeUruguayUzbekistanVanuatuVenezuela, RBVietnamWest Bank and GazaWorldYemen, Rep.ZambiaZimbabwe Timeline:
This timeline shows a graph from 1978 to 2015 of Antigua and Barbuda. No data until 1977. Number of actual observations by date: 38.
Source name:
World Development Indicators
Source organization:
Development Assistance Committee of the Organisation for Economic Co-operation and Development, Geographical Distribution of Financial Flows to Developing Countries, Development Co-operation Report, and International Development Statistics database. Data are available online at: www.oecd.org/dac/stats/idsonline. World Bank GNI estimates are used for the denominator.
Categories, topics:
Aid Effectiveness, Economy & Growth, External Debt
Last updated:
apr 23, 2017
Indicators value changes by year
At the date of observation
Value
Absolute change
Change from previous value
jan 1, 1978
8.158
+8.158
0.0%
jan 1, 1979
4.835
-3.323
-40.73%
jan 1, 1980
3.627
-1.208
-24.99%
jan 1, 1981
5.052
+1.425
39.3%
jan 1, 1982
7.382
+2.33
46.12%
jan 1, 1983
3.687
-3.695
-50.05%
jan 1, 1984
2.213
-1.474
-39.98%
jan 1, 1985
1.363
-0.85
-38.4%
jan 1, 1986
1.481
+0.118
8.65%
jan 1, 1987
2.406
+0.925
62.43%
jan 1, 1988
2.256
-0.15
-6.24%
jan 1, 1989
2.736
+0.48
21.27%
jan 1, 1990
1.316
-1.42
-51.9%
jan 1, 1991
1.331
+0.015
1.17%
jan 1, 1992
1.912
+0.581
43.63%
jan 1, 1993
1.185
-0.727
-38.03%
jan 1, 1994
0.692
-0.493
-41.62%
jan 1, 1995
0.878
+0.187
26.97%
jan 1, 1996
0.486
-0.393
-44.72%
jan 1, 1997
0.777
+0.292
60.05%
jan 1, 1998
0.771
-0.006
-0.79%
jan 1, 1999
1.649
+0.878
113.92%
jan 1, 2000
1.709
+0.06
3.62%
jan 1, 2001
1.324
-0.385
-22.52%
jan 1, 2002
1.14
-0.184
-13.89%
jan 1, 2003
1.77
+0.63
55.22%
jan 1, 2004
0.769
-1.001
-56.56%
jan 1, 2005
0.191
-0.578
-75.15%
jan 1, 2006
0.815
+0.624
326.86%
jan 1, 2007
0.301
-0.514
-63.04%
jan 1, 2008
0.597
+0.295
98.04%
jan 1, 2009
0.68
+0.083
13.98%
jan 1, 2010
0.488
-0.192
-28.25%
jan 1, 2011
1.727
+1.239
253.91%
jan 1, 2012
1.408
-0.32
-18.5%
jan 1, 2013
0.204
-1.204
-85.53%
jan 1, 2014
0.156
-0.048
-23.62%
jan 1, 2015
0.176
+0.02
12.92%
Ranking of countries by current statistics by years


Comments: