29
/
en
AIzaSyAYiBZKx7MnpbEhh9jyipgxe19OcubqV5w
April 1, 2024
240769
Singapore
SGP
true
2
1
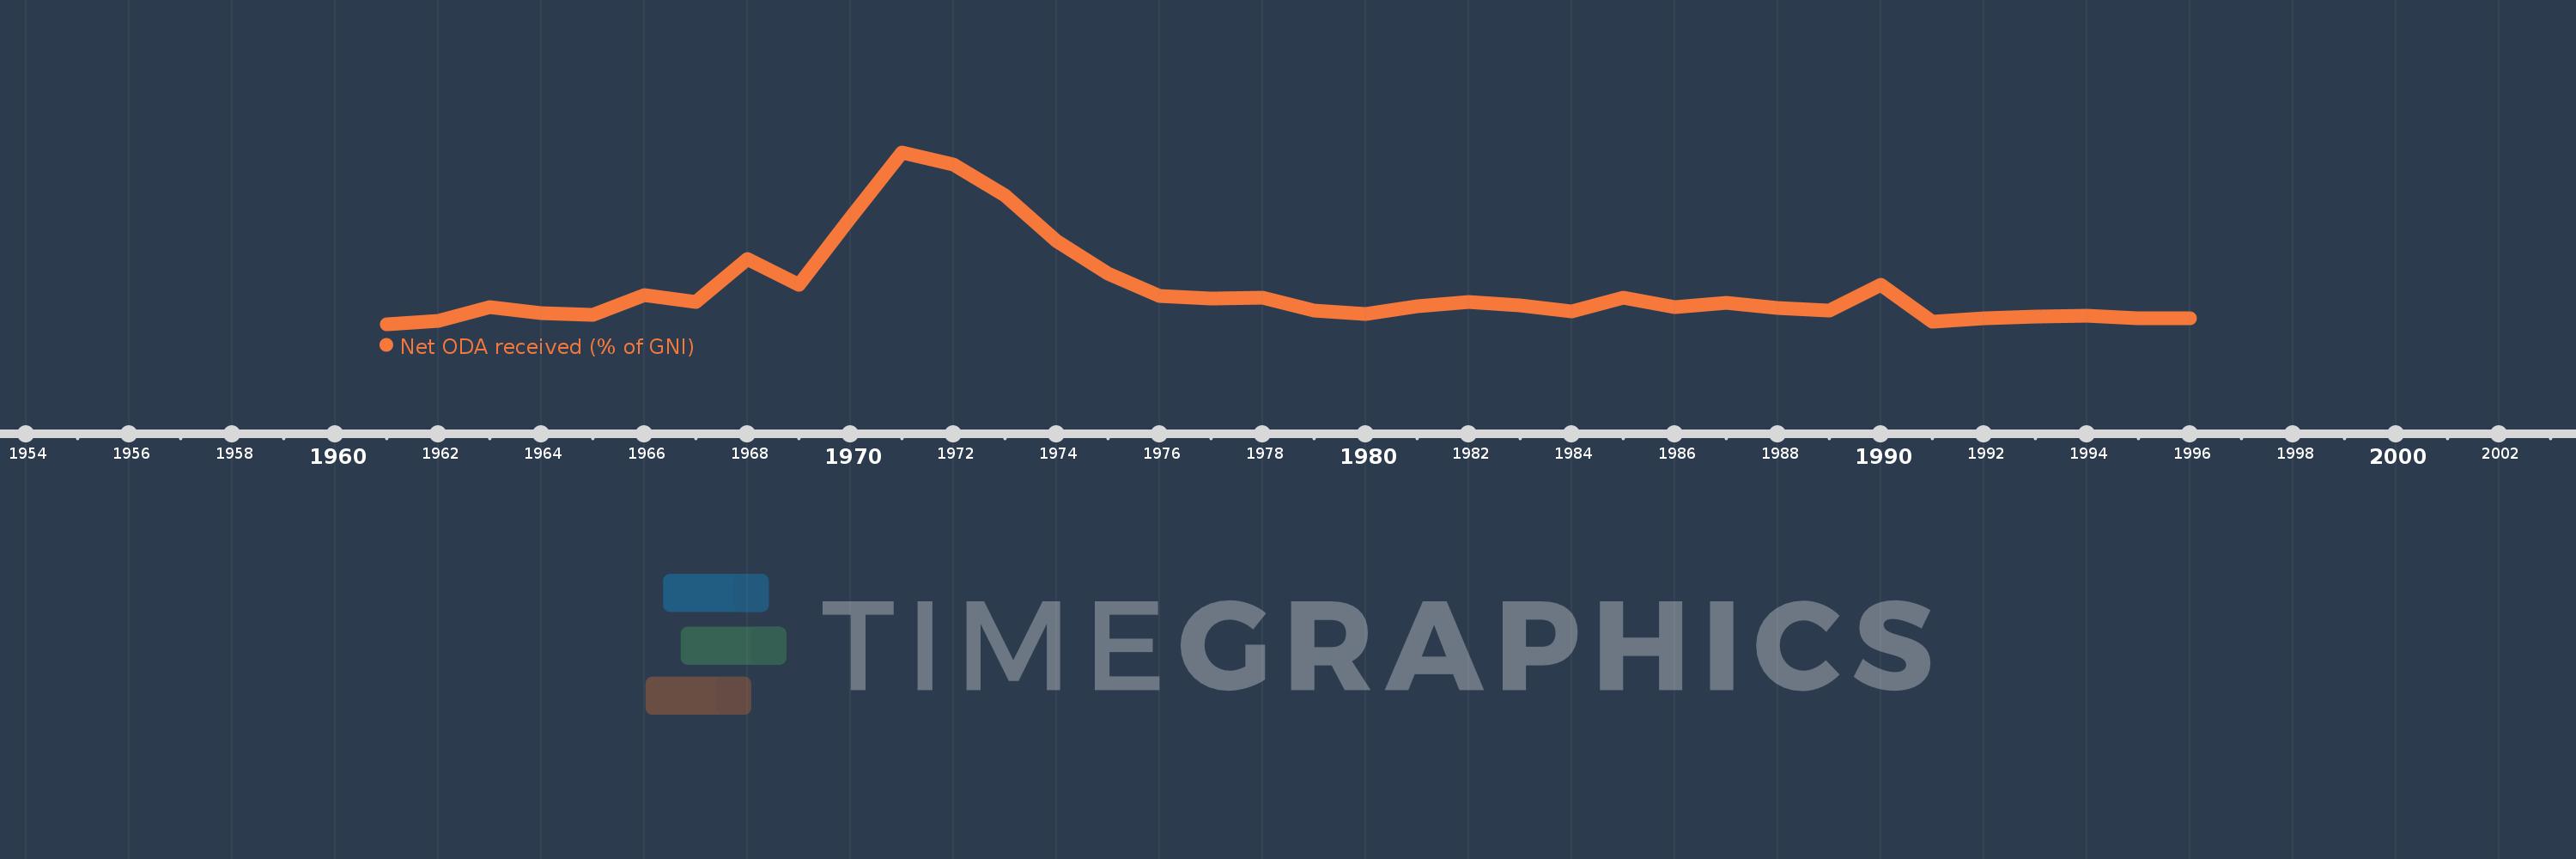
Net ODA received (% of GNI)
1996,1995,1994,1993,1992,1991,1990,1989,1988,1987,1986,1985,1984,1983,1982,1981,1980,1979,1978,1977,1976,1975,1974,1973,1972,1971,1970,1969,1968,1967,1966,1965,1964,1963,1962,1961
This statistics in other country:
AfghanistanAlbaniaAlgeriaAngolaAntigua and BarbudaArab WorldArgentinaArmeniaAzerbaijanBahamas, TheBahrainBangladeshBarbadosBelarusBelizeBeninBermudaBhutanBoliviaBosnia and HerzegovinaBotswanaBrazilBrunei DarussalamBurkina FasoBurundiCabo VerdeCambodiaCameroonCaribbean small statesCentral African RepublicCentral Europe and the BalticsChadChileChinaColombiaComorosCongo, Dem. Rep.Congo, Rep.Costa RicaCote d'IvoireCroatiaCubaCyprusDjiboutiDominicaDominican RepublicEast Asia & PacificEast Asia & Pacific (excluding high income)East Asia & Pacific (IDA & IBRD countries)EcuadorEgypt, Arab Rep.El SalvadorEquatorial GuineaEritreaEthiopiaEuro areaEurope & Central AsiaEurope & Central Asia (excluding high income)Europe & Central Asia (IDA & IBRD countries)European UnionFijiFragile and conflict affected situationsFrench PolynesiaGabonGambia, TheGeorgiaGhanaGrenadaGuatemalaGuineaGuinea-BissauGuyanaHaitiHeavily indebted poor countries (HIPC)High incomeHondurasHong Kong SAR, ChinaIBRD onlyIDA & IBRD totalIDA blendIDA onlyIDA totalIndiaIndonesiaIran, Islamic Rep.IraqIsraelJamaicaJordanKazakhstanKenyaKiribatiKorea, Rep.KosovoKuwaitKyrgyz RepublicLao PDRLatin America & Caribbean Latin America & Caribbean (excluding high income)Latin America & the Caribbean (IDA & IBRD countries)Least developed countries: UN classificationLebanonLesothoLiberiaLibyaLow & middle incomeLow incomeLower middle incomeMacao SAR, ChinaMacedonia, FYRMadagascarMalawiMalaysiaMaldivesMaliMaltaMarshall IslandsMauritaniaMauritiusMexicoMicronesia, Fed. Sts.Middle East & North AfricaMiddle East & North Africa (excluding high income)Middle East & North Africa (IDA & IBRD countries)Middle incomeMoldovaMongoliaMontenegroMoroccoMozambiqueMyanmarNamibiaNauruNepalNew CaledoniaNicaraguaNigerNigeriaNorth AmericaOECD membersOmanOther small statesPacific island small statesPakistanPalauPanamaPapua New GuineaParaguayPeruPhilippinesQatarRwandaSamoaSao Tome and PrincipeSaudi ArabiaSenegalSerbiaSeychellesSierra LeoneSingaporeSloveniaSmall statesSolomon IslandsSomaliaSouth AfricaSouth AsiaSouth Asia (IDA & IBRD)South SudanSri LankaSt. Kitts and NevisSt. LuciaSt. Vincent and the GrenadinesSub-Saharan Africa Sub-Saharan Africa (excluding high income)Sub-Saharan Africa (IDA & IBRD countries)SudanSurinameSwazilandSyrian Arab RepublicTajikistanTanzaniaThailandTimor-LesteTogoTongaTrinidad and TobagoTunisiaTurkeyTurkmenistanTuvaluUgandaUkraineUpper middle incomeUruguayUzbekistanVanuatuVenezuela, RBVietnamWest Bank and GazaWorldYemen, Rep.ZambiaZimbabwe Timeline:
This timeline shows a graph from 1961 to 1996 of Singapore. No data until 1960. Number of actual observations by date: 36.
Source name:
World Development Indicators
Source organization:
Development Assistance Committee of the Organisation for Economic Co-operation and Development, Geographical Distribution of Financial Flows to Developing Countries, Development Co-operation Report, and International Development Statistics database. Data are available online at: www.oecd.org/dac/stats/idsonline. World Bank GNI estimates are used for the denominator.
Categories, topics:
Aid Effectiveness, Economy & Growth, External Debt
Last updated:
apr 23, 2017
Indicators value changes by year
Minimum:
-0.032
jan 1, 1961
At the date of observation
Value
Absolute change
Change from previous value
jan 1, 1961
-0.032
-0.032
0.0%
jan 1, 1962
0.001
+0.033
-104.0%
jan 1, 1963
0.121
+0.12
9.34K%
jan 1, 1964
0.066
-0.055
-45.52%
jan 1, 1965
0.049
-0.017
-26.06%
jan 1, 1966
0.227
+0.178
364.56%
jan 1, 1967
0.165
-0.062
-27.44%
jan 1, 1968
0.543
+0.378
229.93%
jan 1, 1969
0.317
-0.226
-41.57%
jan 1, 1970
0.907
+0.59
186.0%
jan 1, 1971
1.478
+0.571
62.99%
jan 1, 1972
1.369
-0.11
-7.43%
jan 1, 1973
1.098
-0.27
-19.74%
jan 1, 1974
0.701
-0.397
-36.17%
jan 1, 1975
0.416
-0.285
-40.63%
jan 1, 1976
0.216
-0.2
-48.14%
jan 1, 1977
0.195
-0.021
-9.59%
jan 1, 1978
0.2
+0.005
2.53%
jan 1, 1979
0.088
-0.112
-55.81%
jan 1, 1980
0.06
-0.029
-32.58%
jan 1, 1981
0.123
+0.063
106.51%
jan 1, 1982
0.163
+0.04
32.1%
jan 1, 1983
0.134
-0.029
-17.8%
jan 1, 1984
0.083
-0.051
-37.88%
jan 1, 1985
0.205
+0.122
146.61%
jan 1, 1986
0.12
-0.084
-41.16%
jan 1, 1987
0.158
+0.037
30.92%
jan 1, 1988
0.114
-0.043
-27.51%
jan 1, 1989
0.088
-0.027
-23.4%
jan 1, 1990
0.314
+0.226
258.04%
jan 1, 1991
-0.009
-0.322
-102.76%
jan 1, 1992
0.017
+0.026
-300.28%
jan 1, 1993
0.038
+0.021
120.24%
jan 1, 1994
0.04
+0.002
4.22%
jan 1, 1995
0.023
-0.017
-42.69%
jan 1, 1996
0.019
-0.004
-17.54%
Ranking of countries by current statistics by years


Comments: