29
/
en
AIzaSyAYiBZKx7MnpbEhh9jyipgxe19OcubqV5w
April 1, 2024
134988
French Polynesia
PYF
true
2
1
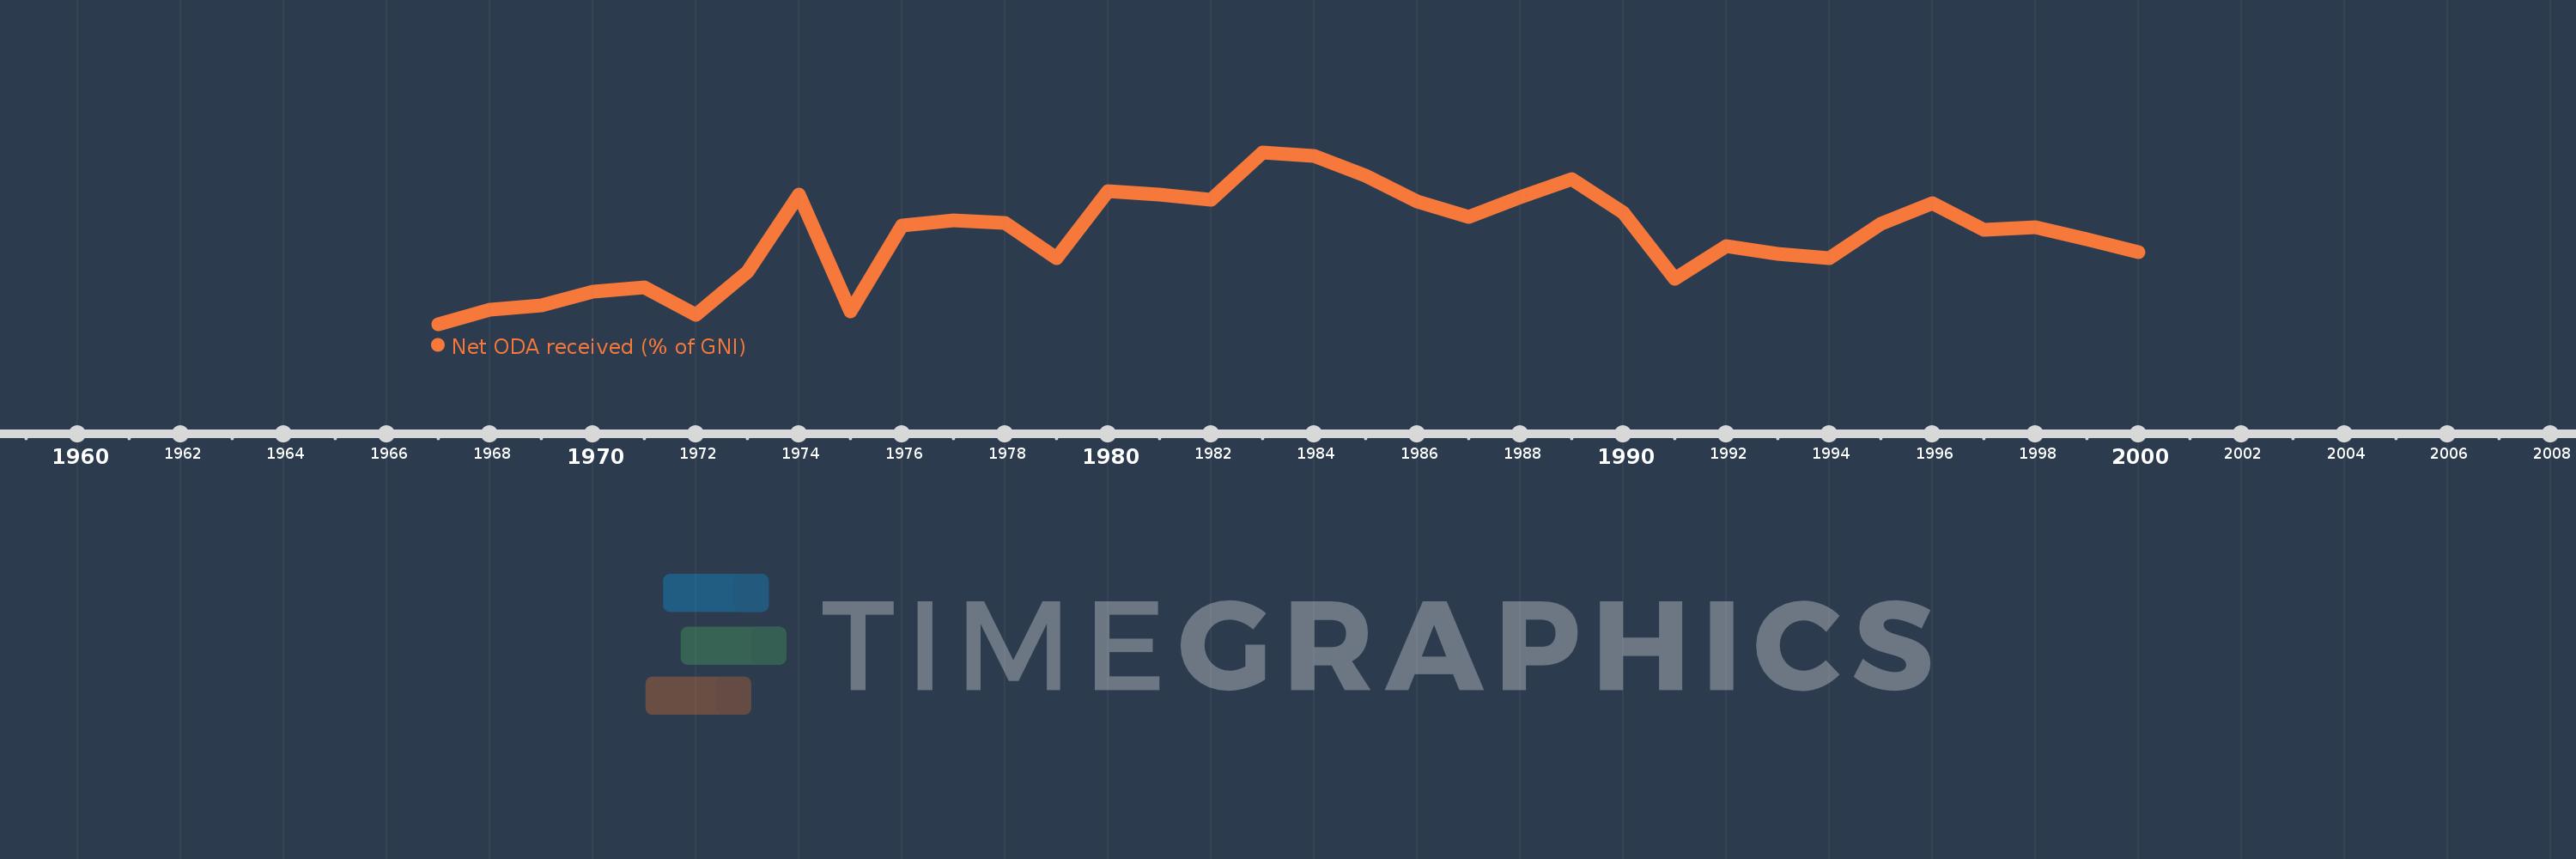
Net ODA received (% of GNI)
2000,1999,1998,1997,1996,1995,1994,1993,1992,1991,1990,1989,1988,1987,1986,1985,1984,1983,1982,1981,1980,1979,1978,1977,1976,1975,1974,1973,1972,1971,1970,1969,1968,1967
This statistics in other country:
AfghanistanAlbaniaAlgeriaAngolaAntigua and BarbudaArab WorldArgentinaArmeniaAzerbaijanBahamas, TheBahrainBangladeshBarbadosBelarusBelizeBeninBermudaBhutanBoliviaBosnia and HerzegovinaBotswanaBrazilBrunei DarussalamBurkina FasoBurundiCabo VerdeCambodiaCameroonCaribbean small statesCentral African RepublicCentral Europe and the BalticsChadChileChinaColombiaComorosCongo, Dem. Rep.Congo, Rep.Costa RicaCote d'IvoireCroatiaCubaCyprusDjiboutiDominicaDominican RepublicEast Asia & PacificEast Asia & Pacific (excluding high income)East Asia & Pacific (IDA & IBRD countries)EcuadorEgypt, Arab Rep.El SalvadorEquatorial GuineaEritreaEthiopiaEuro areaEurope & Central AsiaEurope & Central Asia (excluding high income)Europe & Central Asia (IDA & IBRD countries)European UnionFijiFragile and conflict affected situationsFrench PolynesiaGabonGambia, TheGeorgiaGhanaGrenadaGuatemalaGuineaGuinea-BissauGuyanaHaitiHeavily indebted poor countries (HIPC)High incomeHondurasHong Kong SAR, ChinaIBRD onlyIDA & IBRD totalIDA blendIDA onlyIDA totalIndiaIndonesiaIran, Islamic Rep.IraqIsraelJamaicaJordanKazakhstanKenyaKiribatiKorea, Rep.KosovoKuwaitKyrgyz RepublicLao PDRLatin America & Caribbean Latin America & Caribbean (excluding high income)Latin America & the Caribbean (IDA & IBRD countries)Least developed countries: UN classificationLebanonLesothoLiberiaLibyaLow & middle incomeLow incomeLower middle incomeMacao SAR, ChinaMacedonia, FYRMadagascarMalawiMalaysiaMaldivesMaliMaltaMarshall IslandsMauritaniaMauritiusMexicoMicronesia, Fed. Sts.Middle East & North AfricaMiddle East & North Africa (excluding high income)Middle East & North Africa (IDA & IBRD countries)Middle incomeMoldovaMongoliaMontenegroMoroccoMozambiqueMyanmarNamibiaNauruNepalNew CaledoniaNicaraguaNigerNigeriaNorth AmericaOECD membersOmanOther small statesPacific island small statesPakistanPalauPanamaPapua New GuineaParaguayPeruPhilippinesQatarRwandaSamoaSao Tome and PrincipeSaudi ArabiaSenegalSerbiaSeychellesSierra LeoneSingaporeSloveniaSmall statesSolomon IslandsSomaliaSouth AfricaSouth AsiaSouth Asia (IDA & IBRD)South SudanSri LankaSt. Kitts and NevisSt. LuciaSt. Vincent and the GrenadinesSub-Saharan Africa Sub-Saharan Africa (excluding high income)Sub-Saharan Africa (IDA & IBRD countries)SudanSurinameSwazilandSyrian Arab RepublicTajikistanTanzaniaThailandTimor-LesteTogoTongaTrinidad and TobagoTunisiaTurkeyTurkmenistanTuvaluUgandaUkraineUpper middle incomeUruguayUzbekistanVanuatuVenezuela, RBVietnamWest Bank and GazaWorldYemen, Rep.ZambiaZimbabwe Timeline:
This timeline shows a graph from 1967 to 2000 of French Polynesia. No data until 1966. Number of actual observations by date: 34.
Source name:
World Development Indicators
Source organization:
Development Assistance Committee of the Organisation for Economic Co-operation and Development, Geographical Distribution of Financial Flows to Developing Countries, Development Co-operation Report, and International Development Statistics database. Data are available online at: www.oecd.org/dac/stats/idsonline. World Bank GNI estimates are used for the denominator.
Categories, topics:
Aid Effectiveness, Economy & Growth, External Debt
Last updated:
apr 23, 2017
Indicators value changes by year
Maximum:
13.465
jan 1, 1983
At the date of observation
Value
Absolute change
Change from previous value
jan 1, 1967
6.232
+6.232
0.0%
jan 1, 1968
6.851
+0.619
9.93%
jan 1, 1969
7.019
+0.168
2.45%
jan 1, 1970
7.611
+0.592
8.44%
jan 1, 1971
7.782
+0.172
2.25%
jan 1, 1972
6.632
-1.151
-14.79%
jan 1, 1973
8.437
+1.805
27.22%
jan 1, 1974
11.675
+3.239
38.39%
jan 1, 1975
6.781
-4.894
-41.92%
jan 1, 1976
10.392
+3.611
53.25%
jan 1, 1977
10.604
+0.211
2.04%
jan 1, 1978
10.493
-0.111
-1.04%
jan 1, 1979
9.015
-1.478
-14.09%
jan 1, 1980
11.845
+2.83
31.4%
jan 1, 1981
11.706
-0.138
-1.17%
jan 1, 1982
11.46
-0.247
-2.11%
jan 1, 1983
13.465
+2.005
17.5%
jan 1, 1984
13.309
-0.155
-1.15%
jan 1, 1985
12.476
-0.834
-6.26%
jan 1, 1986
11.411
-1.065
-8.53%
jan 1, 1987
10.758
-0.653
-5.72%
jan 1, 1988
11.579
+0.821
7.63%
jan 1, 1989
12.323
+0.744
6.43%
jan 1, 1990
10.947
-1.376
-11.16%
jan 1, 1991
8.162
-2.785
-25.44%
jan 1, 1992
9.533
+1.37
16.79%
jan 1, 1993
9.184
-0.349
-3.66%
jan 1, 1994
9.026
-0.158
-1.72%
jan 1, 1995
10.445
+1.419
15.72%
jan 1, 1996
11.323
+0.878
8.4%
jan 1, 1997
10.217
-1.106
-9.76%
jan 1, 1998
10.3
+0.082
0.8%
jan 1, 1999
9.811
-0.489
-4.75%
jan 1, 2000
9.257
-0.553
-5.64%
Ranking of countries by current statistics by years


Comments: