29
/
en
AIzaSyAYiBZKx7MnpbEhh9jyipgxe19OcubqV5w
April 1, 2024
58381
South Asia (IDA & IBRD)
TSA
false
2
1
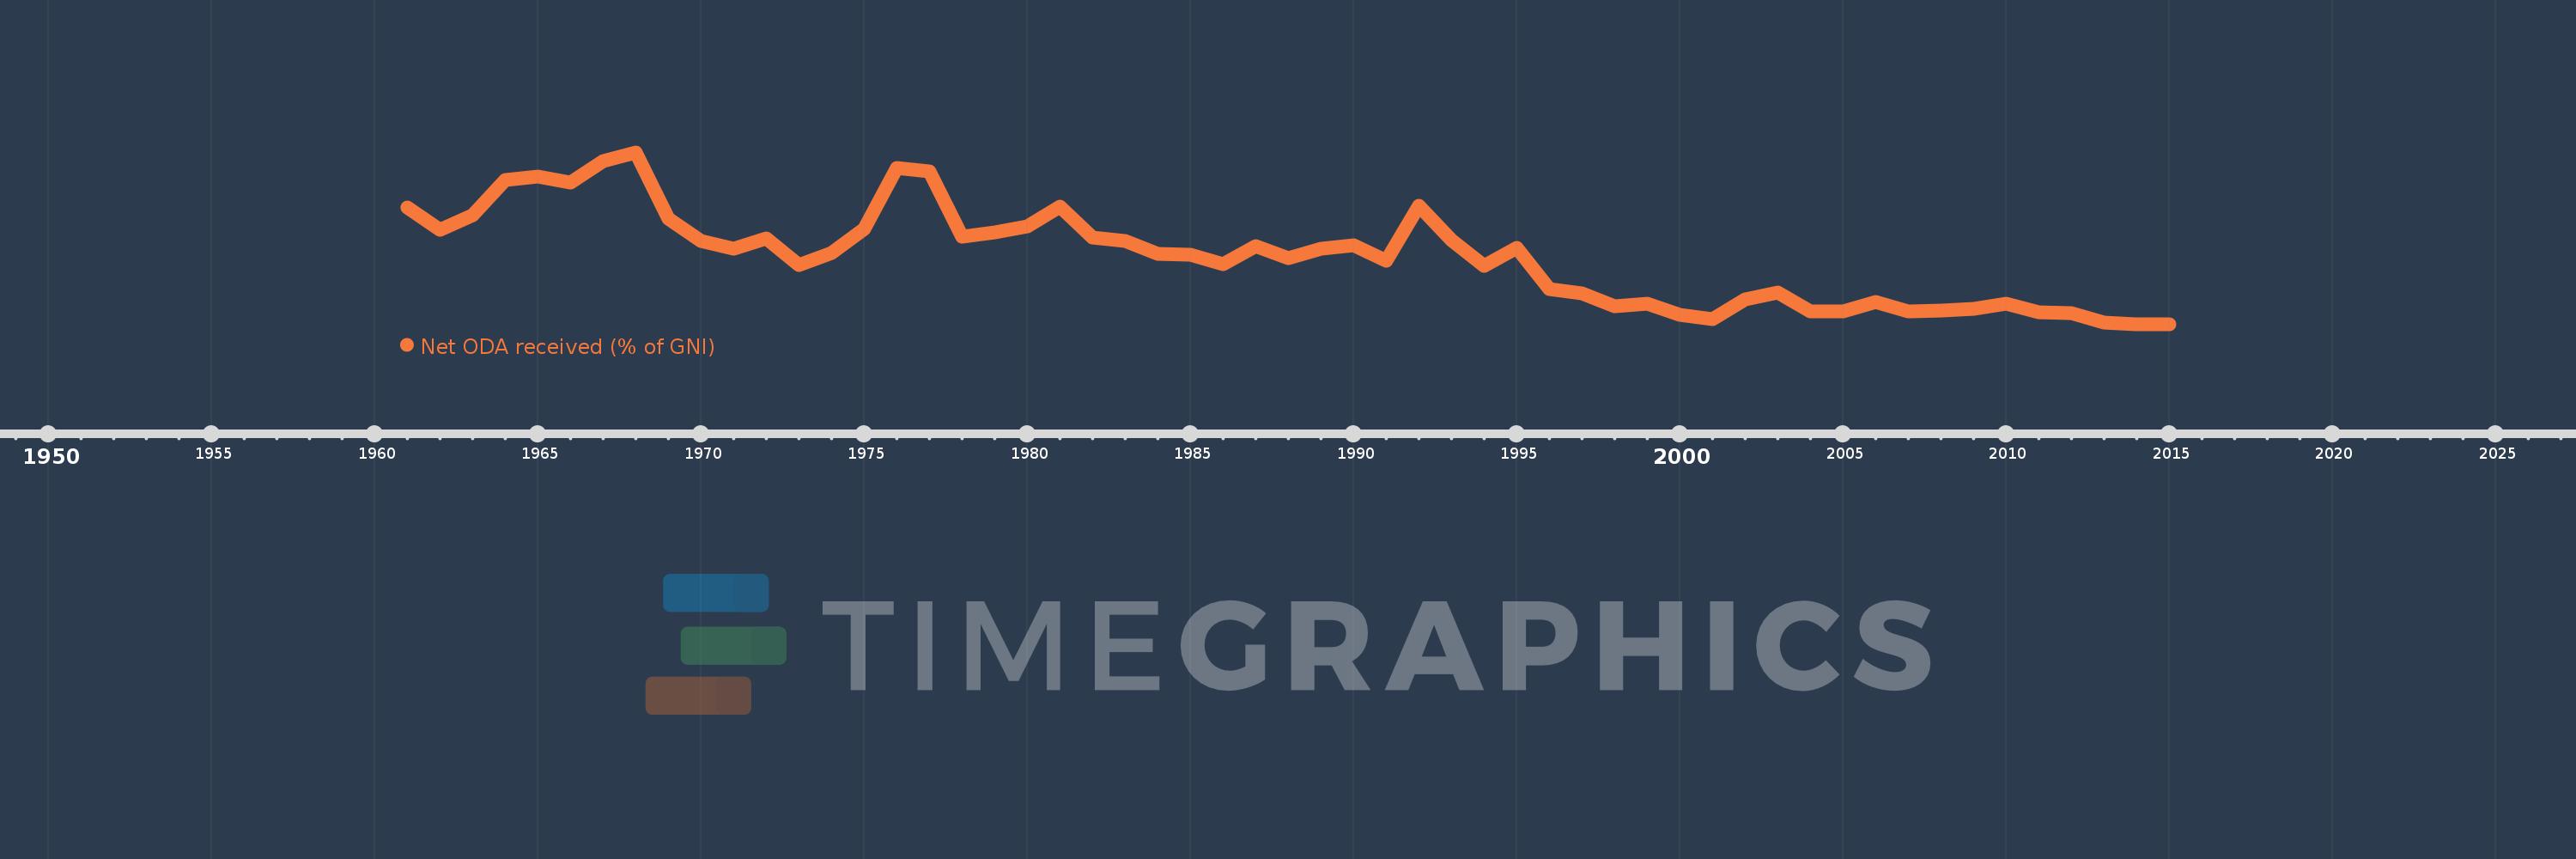
Net ODA received (% of GNI)
2015,2014,2013,2012,2011,2010,2009,2008,2007,2006,2005,2004,2003,2002,2001,2000,1999,1998,1997,1996,1995,1994,1993,1992,1991,1990,1989,1988,1987,1986,1985,1984,1983,1982,1981,1980,1979,1978,1977,1976,1975,1974,1973,1972,1971,1970,1969,1968,1967,1966,1965,1964,1963,1962,1961
This statistics in other country:
AfghanistanAlbaniaAlgeriaAngolaAntigua and BarbudaArab WorldArgentinaArmeniaAzerbaijanBahamas, TheBahrainBangladeshBarbadosBelarusBelizeBeninBermudaBhutanBoliviaBosnia and HerzegovinaBotswanaBrazilBrunei DarussalamBurkina FasoBurundiCabo VerdeCambodiaCameroonCaribbean small statesCentral African RepublicCentral Europe and the BalticsChadChileChinaColombiaComorosCongo, Dem. Rep.Congo, Rep.Costa RicaCote d'IvoireCroatiaCubaCyprusDjiboutiDominicaDominican RepublicEast Asia & PacificEast Asia & Pacific (excluding high income)East Asia & Pacific (IDA & IBRD countries)EcuadorEgypt, Arab Rep.El SalvadorEquatorial GuineaEritreaEthiopiaEuro areaEurope & Central AsiaEurope & Central Asia (excluding high income)Europe & Central Asia (IDA & IBRD countries)European UnionFijiFragile and conflict affected situationsFrench PolynesiaGabonGambia, TheGeorgiaGhanaGrenadaGuatemalaGuineaGuinea-BissauGuyanaHaitiHeavily indebted poor countries (HIPC)High incomeHondurasHong Kong SAR, ChinaIBRD onlyIDA & IBRD totalIDA blendIDA onlyIDA totalIndiaIndonesiaIran, Islamic Rep.IraqIsraelJamaicaJordanKazakhstanKenyaKiribatiKorea, Rep.KosovoKuwaitKyrgyz RepublicLao PDRLatin America & Caribbean Latin America & Caribbean (excluding high income)Latin America & the Caribbean (IDA & IBRD countries)Least developed countries: UN classificationLebanonLesothoLiberiaLibyaLow & middle incomeLow incomeLower middle incomeMacao SAR, ChinaMacedonia, FYRMadagascarMalawiMalaysiaMaldivesMaliMaltaMarshall IslandsMauritaniaMauritiusMexicoMicronesia, Fed. Sts.Middle East & North AfricaMiddle East & North Africa (excluding high income)Middle East & North Africa (IDA & IBRD countries)Middle incomeMoldovaMongoliaMontenegroMoroccoMozambiqueMyanmarNamibiaNauruNepalNew CaledoniaNicaraguaNigerNigeriaNorth AmericaOECD membersOmanOther small statesPacific island small statesPakistanPalauPanamaPapua New GuineaParaguayPeruPhilippinesQatarRwandaSamoaSao Tome and PrincipeSaudi ArabiaSenegalSerbiaSeychellesSierra LeoneSingaporeSloveniaSmall statesSolomon IslandsSomaliaSouth AfricaSouth AsiaSouth Asia (IDA & IBRD)South SudanSri LankaSt. Kitts and NevisSt. LuciaSt. Vincent and the GrenadinesSub-Saharan Africa Sub-Saharan Africa (excluding high income)Sub-Saharan Africa (IDA & IBRD countries)SudanSurinameSwazilandSyrian Arab RepublicTajikistanTanzaniaThailandTimor-LesteTogoTongaTrinidad and TobagoTunisiaTurkeyTurkmenistanTuvaluUgandaUkraineUpper middle incomeUruguayUzbekistanVanuatuVenezuela, RBVietnamWest Bank and GazaWorldYemen, Rep.ZambiaZimbabwe Timeline:
This timeline shows a graph from 1961 to 2015 of South Asia (IDA & IBRD). No data until 1960. Number of actual observations by date: 55.
Source name:
World Development Indicators
Source organization:
Development Assistance Committee of the Organisation for Economic Co-operation and Development, Geographical Distribution of Financial Flows to Developing Countries, Development Co-operation Report, and International Development Statistics database. Data are available online at: www.oecd.org/dac/stats/idsonline. World Bank GNI estimates are used for the denominator.
Categories, topics:
Aid Effectiveness, Economy & Growth, External Debt
Last updated:
apr 23, 2017
Indicators value changes by year
At the date of observation
Value
Absolute change
Change from previous value
jan 1, 1961
2.172
+2.172
0.0%
jan 1, 1962
1.862
-0.31
-14.25%
jan 1, 1963
2.062
+0.2
10.72%
jan 1, 1964
2.535
+0.473
22.94%
jan 1, 1965
2.582
+0.047
1.86%
jan 1, 1966
2.501
-0.081
-3.14%
jan 1, 1967
2.793
+0.292
11.66%
jan 1, 1968
2.91
+0.117
4.19%
jan 1, 1969
2.011
-0.898
-30.87%
jan 1, 1970
1.709
-0.303
-15.04%
jan 1, 1971
1.608
-0.101
-5.92%
jan 1, 1972
1.745
+0.138
8.55%
jan 1, 1973
1.384
-0.362
-20.73%
jan 1, 1974
1.546
+0.162
11.73%
jan 1, 1975
1.872
+0.326
21.11%
jan 1, 1976
2.696
+0.824
44.01%
jan 1, 1977
2.652
-0.044
-1.62%
jan 1, 1978
1.767
-0.886
-33.39%
jan 1, 1979
1.832
+0.066
3.73%
jan 1, 1980
1.907
+0.075
4.09%
jan 1, 1981
2.181
+0.274
14.34%
jan 1, 1982
1.756
-0.425
-19.48%
jan 1, 1983
1.713
-0.043
-2.43%
jan 1, 1984
1.537
-0.177
-10.31%
jan 1, 1985
1.531
-0.005
-0.34%
jan 1, 1986
1.401
-0.13
-8.5%
jan 1, 1987
1.646
+0.245
17.47%
jan 1, 1988
1.48
-0.166
-10.09%
jan 1, 1989
1.612
+0.132
8.89%
jan 1, 1990
1.656
+0.044
2.73%
jan 1, 1991
1.453
-0.203
-12.24%
jan 1, 1992
2.194
+0.74
50.96%
jan 1, 1993
1.72
-0.474
-21.61%
jan 1, 1994
1.373
-0.346
-20.13%
jan 1, 1995
1.624
+0.251
18.24%
jan 1, 1996
1.069
-0.555
-34.19%
jan 1, 1997
1.003
-0.066
-6.18%
jan 1, 1998
0.832
-0.171
-17.01%
jan 1, 1999
0.872
+0.04
4.75%
jan 1, 2000
0.713
-0.158
-18.17%
jan 1, 2001
0.659
-0.054
-7.58%
jan 1, 2002
0.926
+0.267
40.49%
jan 1, 2003
1.013
+0.087
9.36%
jan 1, 2004
0.76
-0.253
-24.97%
jan 1, 2005
0.759
-0.001
-0.14%
jan 1, 2006
0.892
+0.134
17.62%
jan 1, 2007
0.764
-0.128
-14.37%
jan 1, 2008
0.771
+0.006
0.83%
jan 1, 2009
0.803
+0.032
4.18%
jan 1, 2010
0.865
+0.063
7.81%
jan 1, 2011
0.753
-0.113
-13.02%
jan 1, 2012
0.738
-0.014
-1.92%
jan 1, 2013
0.608
-0.131
-17.71%
jan 1, 2014
0.59
-0.017
-2.83%
jan 1, 2015
0.594
+0.004
0.68%
Ranking of countries by current statistics by years


Comments: