29
/
en
AIzaSyAYiBZKx7MnpbEhh9jyipgxe19OcubqV5w
April 1, 2024
269736
Turkey
TUR
true
2
1
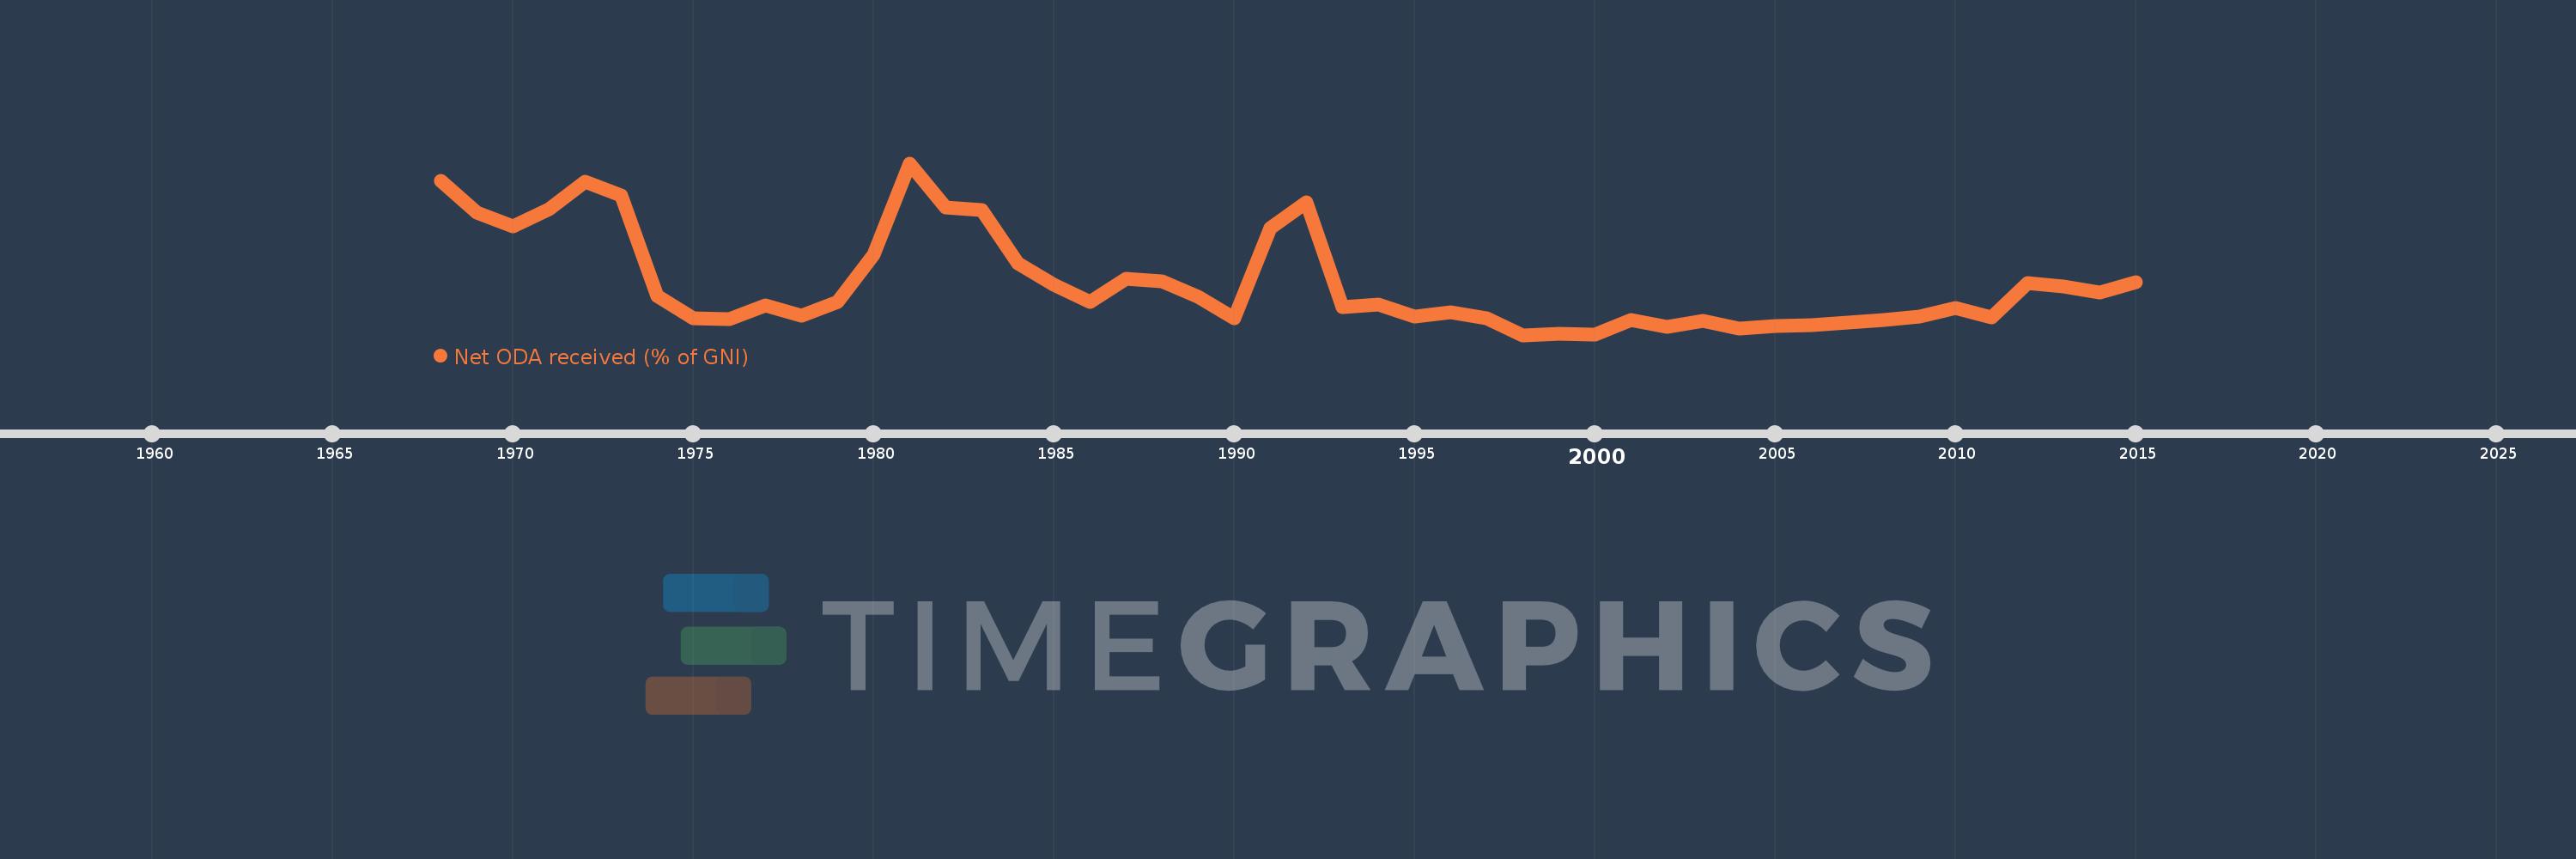
Net ODA received (% of GNI)
2015,2014,2013,2012,2011,2010,2009,2008,2007,2006,2005,2004,2003,2002,2001,2000,1999,1998,1997,1996,1995,1994,1993,1992,1991,1990,1989,1988,1987,1986,1985,1984,1983,1982,1981,1980,1979,1978,1977,1976,1975,1974,1973,1972,1971,1970,1969,1968
This statistics in other country:
AfghanistanAlbaniaAlgeriaAngolaAntigua and BarbudaArab WorldArgentinaArmeniaAzerbaijanBahamas, TheBahrainBangladeshBarbadosBelarusBelizeBeninBermudaBhutanBoliviaBosnia and HerzegovinaBotswanaBrazilBrunei DarussalamBurkina FasoBurundiCabo VerdeCambodiaCameroonCaribbean small statesCentral African RepublicCentral Europe and the BalticsChadChileChinaColombiaComorosCongo, Dem. Rep.Congo, Rep.Costa RicaCote d'IvoireCroatiaCubaCyprusDjiboutiDominicaDominican RepublicEast Asia & PacificEast Asia & Pacific (excluding high income)East Asia & Pacific (IDA & IBRD countries)EcuadorEgypt, Arab Rep.El SalvadorEquatorial GuineaEritreaEthiopiaEuro areaEurope & Central AsiaEurope & Central Asia (excluding high income)Europe & Central Asia (IDA & IBRD countries)European UnionFijiFragile and conflict affected situationsFrench PolynesiaGabonGambia, TheGeorgiaGhanaGrenadaGuatemalaGuineaGuinea-BissauGuyanaHaitiHeavily indebted poor countries (HIPC)High incomeHondurasHong Kong SAR, ChinaIBRD onlyIDA & IBRD totalIDA blendIDA onlyIDA totalIndiaIndonesiaIran, Islamic Rep.IraqIsraelJamaicaJordanKazakhstanKenyaKiribatiKorea, Rep.KosovoKuwaitKyrgyz RepublicLao PDRLatin America & Caribbean Latin America & Caribbean (excluding high income)Latin America & the Caribbean (IDA & IBRD countries)Least developed countries: UN classificationLebanonLesothoLiberiaLibyaLow & middle incomeLow incomeLower middle incomeMacao SAR, ChinaMacedonia, FYRMadagascarMalawiMalaysiaMaldivesMaliMaltaMarshall IslandsMauritaniaMauritiusMexicoMicronesia, Fed. Sts.Middle East & North AfricaMiddle East & North Africa (excluding high income)Middle East & North Africa (IDA & IBRD countries)Middle incomeMoldovaMongoliaMontenegroMoroccoMozambiqueMyanmarNamibiaNauruNepalNew CaledoniaNicaraguaNigerNigeriaNorth AmericaOECD membersOmanOther small statesPacific island small statesPakistanPalauPanamaPapua New GuineaParaguayPeruPhilippinesQatarRwandaSamoaSao Tome and PrincipeSaudi ArabiaSenegalSerbiaSeychellesSierra LeoneSingaporeSloveniaSmall statesSolomon IslandsSomaliaSouth AfricaSouth AsiaSouth Asia (IDA & IBRD)South SudanSri LankaSt. Kitts and NevisSt. LuciaSt. Vincent and the GrenadinesSub-Saharan Africa Sub-Saharan Africa (excluding high income)Sub-Saharan Africa (IDA & IBRD countries)SudanSurinameSwazilandSyrian Arab RepublicTajikistanTanzaniaThailandTimor-LesteTogoTongaTrinidad and TobagoTunisiaTurkeyTurkmenistanTuvaluUgandaUkraineUpper middle incomeUruguayUzbekistanVanuatuVenezuela, RBVietnamWest Bank and GazaWorldYemen, Rep.ZambiaZimbabwe Timeline:
This timeline shows a graph from 1968 to 2015 of Turkey. No data until 1967. Number of actual observations by date: 48.
Source name:
World Development Indicators
Source organization:
Development Assistance Committee of the Organisation for Economic Co-operation and Development, Geographical Distribution of Financial Flows to Developing Countries, Development Co-operation Report, and International Development Statistics database. Data are available online at: www.oecd.org/dac/stats/idsonline. World Bank GNI estimates are used for the denominator.
Categories, topics:
Aid Effectiveness, Economy & Growth, External Debt
Last updated:
apr 23, 2017
Indicators value changes by year
At the date of observation
Value
Absolute change
Change from previous value
jan 1, 1968
1.268
+1.268
0.0%
jan 1, 1969
1.003
-0.265
-20.87%
jan 1, 1970
0.889
-0.114
-11.37%
jan 1, 1971
1.034
+0.145
16.28%
jan 1, 1972
1.259
+0.226
21.82%
jan 1, 1973
1.145
-0.114
-9.08%
jan 1, 1974
0.324
-0.821
-71.69%
jan 1, 1975
0.142
-0.182
-56.27%
jan 1, 1976
0.131
-0.01
-7.26%
jan 1, 1977
0.247
+0.115
87.82%
jan 1, 1978
0.159
-0.087
-35.42%
jan 1, 1979
0.272
+0.112
70.4%
jan 1, 1980
0.66
+0.388
143.04%
jan 1, 1981
1.409
+0.748
113.39%
jan 1, 1982
1.045
-0.364
-25.83%
jan 1, 1983
1.026
-0.018
-1.77%
jan 1, 1984
0.591
-0.436
-42.45%
jan 1, 1985
0.411
-0.179
-30.39%
jan 1, 1986
0.274
-0.137
-33.31%
jan 1, 1987
0.46
+0.186
67.88%
jan 1, 1988
0.445
-0.015
-3.27%
jan 1, 1989
0.319
-0.126
-28.36%
jan 1, 1990
0.138
-0.181
-56.66%
jan 1, 1991
0.88
+0.742
536.51%
jan 1, 1992
1.092
+0.212
24.14%
jan 1, 1993
0.229
-0.864
-79.07%
jan 1, 1994
0.252
+0.023
10.13%
jan 1, 1995
0.155
-0.097
-38.49%
jan 1, 1996
0.188
+0.033
21.37%
jan 1, 1997
0.137
-0.051
-26.98%
jan 1, 1998
0.003
-0.134
-97.76%
jan 1, 1999
0.011
+0.007
243.78%
jan 1, 2000
0.004
-0.006
-59.78%
jan 1, 2001
0.125
+0.12
2.83K%
jan 1, 2002
0.069
-0.056
-44.66%
jan 1, 2003
0.122
+0.054
77.66%
jan 1, 2004
0.055
-0.067
-54.8%
jan 1, 2005
0.074
+0.018
33.37%
jan 1, 2006
0.083
+0.009
12.34%
jan 1, 2007
0.108
+0.025
29.98%
jan 1, 2008
0.124
+0.016
14.69%
jan 1, 2009
0.154
+0.031
24.94%
jan 1, 2010
0.224
+0.07
45.26%
jan 1, 2011
0.144
-0.08
-35.59%
jan 1, 2012
0.428
+0.284
196.51%
jan 1, 2013
0.398
-0.031
-7.2%
jan 1, 2014
0.349
-0.049
-12.24%
jan 1, 2015
0.435
+0.086
24.75%
Ranking of countries by current statistics by years


Comments: