29
/
en
AIzaSyAYiBZKx7MnpbEhh9jyipgxe19OcubqV5w
April 1, 2024
24361
Arab World
ARB
false
2
1
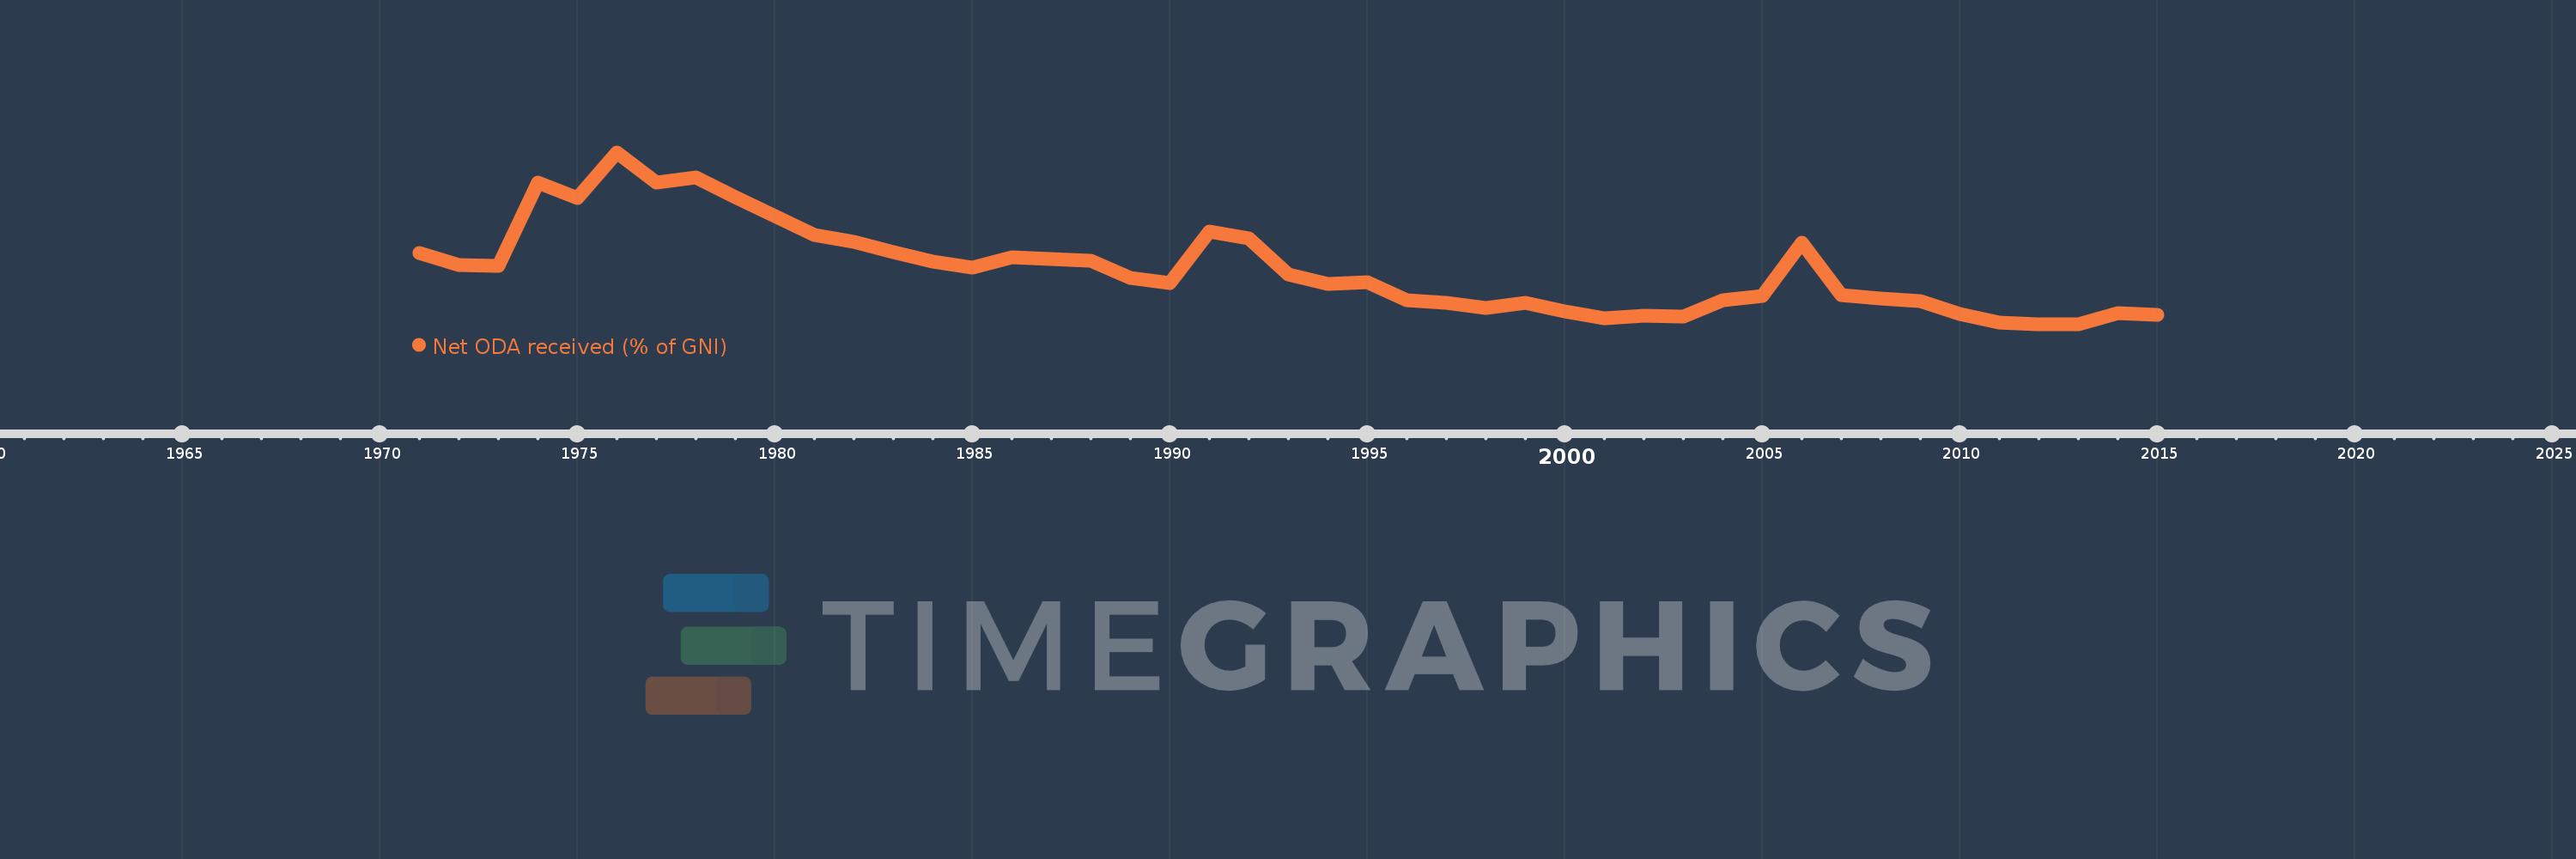
Net ODA received (% of GNI)
2015,2014,2013,2012,2011,2010,2009,2008,2007,2006,2005,2004,2003,2002,2001,2000,1999,1998,1997,1996,1995,1994,1993,1992,1991,1990,1989,1988,1987,1986,1985,1984,1983,1982,1981,1980,1979,1978,1977,1976,1975,1974,1973,1972,1971
This statistics in other country:
AfghanistanAlbaniaAlgeriaAngolaAntigua and BarbudaArab WorldArgentinaArmeniaAzerbaijanBahamas, TheBahrainBangladeshBarbadosBelarusBelizeBeninBermudaBhutanBoliviaBosnia and HerzegovinaBotswanaBrazilBrunei DarussalamBurkina FasoBurundiCabo VerdeCambodiaCameroonCaribbean small statesCentral African RepublicCentral Europe and the BalticsChadChileChinaColombiaComorosCongo, Dem. Rep.Congo, Rep.Costa RicaCote d'IvoireCroatiaCubaCyprusDjiboutiDominicaDominican RepublicEast Asia & PacificEast Asia & Pacific (excluding high income)East Asia & Pacific (IDA & IBRD countries)EcuadorEgypt, Arab Rep.El SalvadorEquatorial GuineaEritreaEthiopiaEuro areaEurope & Central AsiaEurope & Central Asia (excluding high income)Europe & Central Asia (IDA & IBRD countries)European UnionFijiFragile and conflict affected situationsFrench PolynesiaGabonGambia, TheGeorgiaGhanaGrenadaGuatemalaGuineaGuinea-BissauGuyanaHaitiHeavily indebted poor countries (HIPC)High incomeHondurasHong Kong SAR, ChinaIBRD onlyIDA & IBRD totalIDA blendIDA onlyIDA totalIndiaIndonesiaIran, Islamic Rep.IraqIsraelJamaicaJordanKazakhstanKenyaKiribatiKorea, Rep.KosovoKuwaitKyrgyz RepublicLao PDRLatin America & Caribbean Latin America & Caribbean (excluding high income)Latin America & the Caribbean (IDA & IBRD countries)Least developed countries: UN classificationLebanonLesothoLiberiaLibyaLow & middle incomeLow incomeLower middle incomeMacao SAR, ChinaMacedonia, FYRMadagascarMalawiMalaysiaMaldivesMaliMaltaMarshall IslandsMauritaniaMauritiusMexicoMicronesia, Fed. Sts.Middle East & North AfricaMiddle East & North Africa (excluding high income)Middle East & North Africa (IDA & IBRD countries)Middle incomeMoldovaMongoliaMontenegroMoroccoMozambiqueMyanmarNamibiaNauruNepalNew CaledoniaNicaraguaNigerNigeriaNorth AmericaOECD membersOmanOther small statesPacific island small statesPakistanPalauPanamaPapua New GuineaParaguayPeruPhilippinesQatarRwandaSamoaSao Tome and PrincipeSaudi ArabiaSenegalSerbiaSeychellesSierra LeoneSingaporeSloveniaSmall statesSolomon IslandsSomaliaSouth AfricaSouth AsiaSouth Asia (IDA & IBRD)South SudanSri LankaSt. Kitts and NevisSt. LuciaSt. Vincent and the GrenadinesSub-Saharan Africa Sub-Saharan Africa (excluding high income)Sub-Saharan Africa (IDA & IBRD countries)SudanSurinameSwazilandSyrian Arab RepublicTajikistanTanzaniaThailandTimor-LesteTogoTongaTrinidad and TobagoTunisiaTurkeyTurkmenistanTuvaluUgandaUkraineUpper middle incomeUruguayUzbekistanVanuatuVenezuela, RBVietnamWest Bank and GazaWorldYemen, Rep.ZambiaZimbabwe Timeline:
This timeline shows a graph from 1971 to 2015 of Arab World. No data until 1970. Number of actual observations by date: 45.
Source name:
World Development Indicators
Source organization:
Development Assistance Committee of the Organisation for Economic Co-operation and Development, Geographical Distribution of Financial Flows to Developing Countries, Development Co-operation Report, and International Development Statistics database. Data are available online at: www.oecd.org/dac/stats/idsonline. World Bank GNI estimates are used for the denominator.
Categories, topics:
Aid Effectiveness, Economy & Growth, External Debt
Last updated:
apr 23, 2017
Indicators value changes by year
At the date of observation
Value
Absolute change
Change from previous value
jan 1, 1971
2.238
+2.238
0.0%
jan 1, 1972
1.947
-0.29
-12.98%
jan 1, 1973
1.932
-0.015
-0.76%
jan 1, 1974
3.901
+1.968
101.86%
jan 1, 1975
3.533
-0.368
-9.43%
jan 1, 1976
4.613
+1.081
30.6%
jan 1, 1977
3.891
-0.722
-15.66%
jan 1, 1978
4.017
+0.125
3.22%
jan 1, 1979
3.563
-0.454
-11.3%
jan 1, 1980
3.102
-0.461
-12.93%
jan 1, 1981
2.665
-0.438
-14.1%
jan 1, 1982
2.501
-0.163
-6.13%
jan 1, 1983
2.248
-0.253
-10.1%
jan 1, 1984
2.041
-0.208
-9.23%
jan 1, 1985
1.885
-0.156
-7.63%
jan 1, 1986
2.141
+0.256
13.59%
jan 1, 1987
2.092
-0.05
-2.32%
jan 1, 1988
2.055
-0.036
-1.74%
jan 1, 1989
1.635
-0.42
-20.42%
jan 1, 1990
1.519
-0.117
-7.12%
jan 1, 1991
2.734
+1.215
79.96%
jan 1, 1992
2.572
-0.161
-5.91%
jan 1, 1993
1.728
-0.844
-32.82%
jan 1, 1994
1.511
-0.217
-12.56%
jan 1, 1995
1.552
+0.041
2.7%
jan 1, 1996
1.116
-0.436
-28.08%
jan 1, 1997
1.066
-0.05
-4.45%
jan 1, 1998
0.934
-0.132
-12.38%
jan 1, 1999
1.055
+0.12
12.87%
jan 1, 2000
0.843
-0.212
-20.08%
jan 1, 2001
0.692
-0.151
-17.91%
jan 1, 2002
0.759
+0.067
9.73%
jan 1, 2003
0.728
-0.032
-4.17%
jan 1, 2004
1.112
+0.384
52.84%
jan 1, 2005
1.221
+0.109
9.84%
jan 1, 2006
2.473
+1.252
102.48%
jan 1, 2007
1.241
-1.232
-49.81%
jan 1, 2008
1.151
-0.091
-7.31%
jan 1, 2009
1.087
-0.063
-5.48%
jan 1, 2010
0.799
-0.288
-26.51%
jan 1, 2011
0.59
-0.209
-26.18%
jan 1, 2012
0.55
-0.04
-6.77%
jan 1, 2013
0.554
+0.004
0.72%
jan 1, 2014
0.804
+0.25
45.07%
jan 1, 2015
0.775
-0.028
-3.53%
Ranking of countries by current statistics by years


Comments: