29
/
en
AIzaSyAYiBZKx7MnpbEhh9jyipgxe19OcubqV5w
April 1, 2024
278042
Uruguay
URY
true
2
1
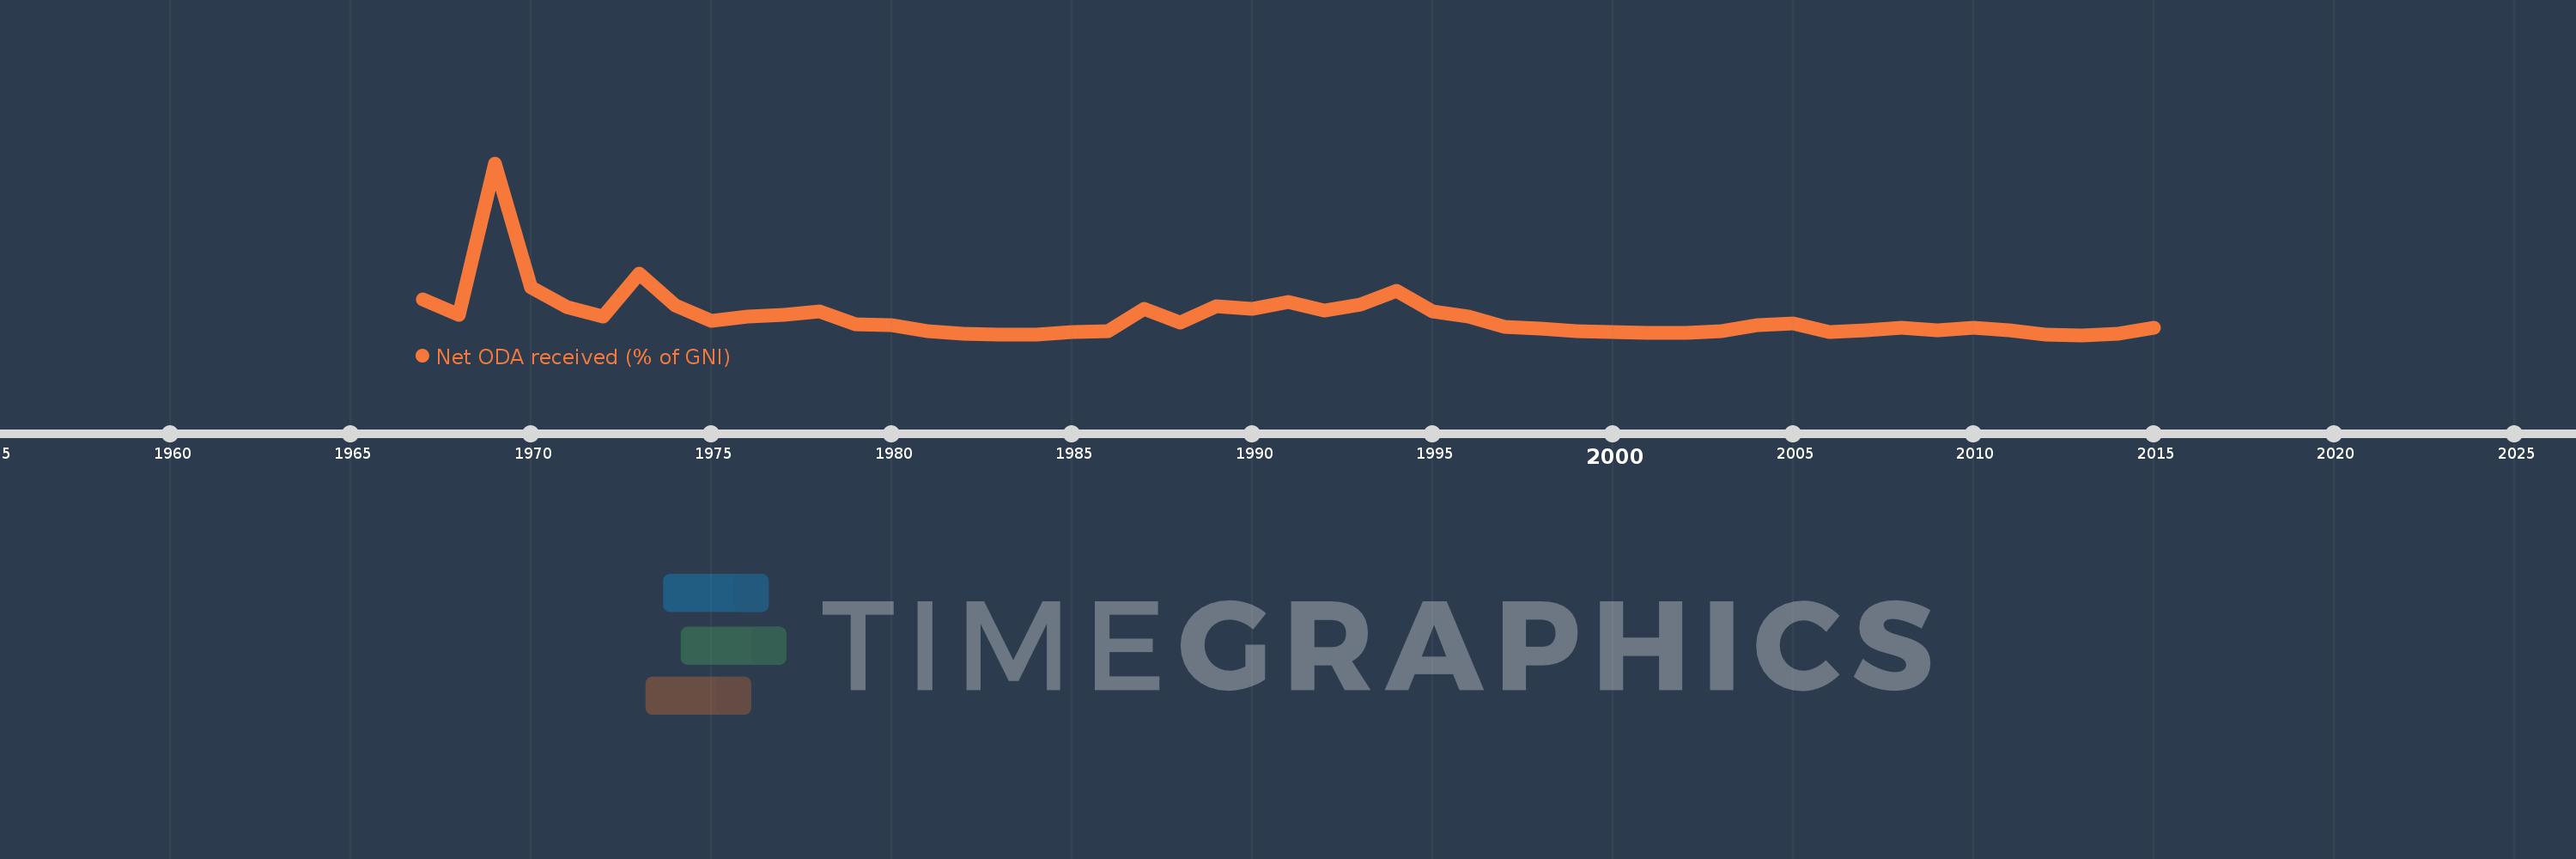
Net ODA received (% of GNI)
2015,2014,2013,2012,2011,2010,2009,2008,2007,2006,2005,2004,2003,2002,2001,2000,1999,1998,1997,1996,1995,1994,1993,1992,1991,1990,1989,1988,1987,1986,1985,1984,1983,1982,1981,1980,1979,1978,1977,1976,1975,1974,1973,1972,1971,1970,1969,1968,1967
This statistics in other country:
AfghanistanAlbaniaAlgeriaAngolaAntigua and BarbudaArab WorldArgentinaArmeniaAzerbaijanBahamas, TheBahrainBangladeshBarbadosBelarusBelizeBeninBermudaBhutanBoliviaBosnia and HerzegovinaBotswanaBrazilBrunei DarussalamBurkina FasoBurundiCabo VerdeCambodiaCameroonCaribbean small statesCentral African RepublicCentral Europe and the BalticsChadChileChinaColombiaComorosCongo, Dem. Rep.Congo, Rep.Costa RicaCote d'IvoireCroatiaCubaCyprusDjiboutiDominicaDominican RepublicEast Asia & PacificEast Asia & Pacific (excluding high income)East Asia & Pacific (IDA & IBRD countries)EcuadorEgypt, Arab Rep.El SalvadorEquatorial GuineaEritreaEthiopiaEuro areaEurope & Central AsiaEurope & Central Asia (excluding high income)Europe & Central Asia (IDA & IBRD countries)European UnionFijiFragile and conflict affected situationsFrench PolynesiaGabonGambia, TheGeorgiaGhanaGrenadaGuatemalaGuineaGuinea-BissauGuyanaHaitiHeavily indebted poor countries (HIPC)High incomeHondurasHong Kong SAR, ChinaIBRD onlyIDA & IBRD totalIDA blendIDA onlyIDA totalIndiaIndonesiaIran, Islamic Rep.IraqIsraelJamaicaJordanKazakhstanKenyaKiribatiKorea, Rep.KosovoKuwaitKyrgyz RepublicLao PDRLatin America & Caribbean Latin America & Caribbean (excluding high income)Latin America & the Caribbean (IDA & IBRD countries)Least developed countries: UN classificationLebanonLesothoLiberiaLibyaLow & middle incomeLow incomeLower middle incomeMacao SAR, ChinaMacedonia, FYRMadagascarMalawiMalaysiaMaldivesMaliMaltaMarshall IslandsMauritaniaMauritiusMexicoMicronesia, Fed. Sts.Middle East & North AfricaMiddle East & North Africa (excluding high income)Middle East & North Africa (IDA & IBRD countries)Middle incomeMoldovaMongoliaMontenegroMoroccoMozambiqueMyanmarNamibiaNauruNepalNew CaledoniaNicaraguaNigerNigeriaNorth AmericaOECD membersOmanOther small statesPacific island small statesPakistanPalauPanamaPapua New GuineaParaguayPeruPhilippinesQatarRwandaSamoaSao Tome and PrincipeSaudi ArabiaSenegalSerbiaSeychellesSierra LeoneSingaporeSloveniaSmall statesSolomon IslandsSomaliaSouth AfricaSouth AsiaSouth Asia (IDA & IBRD)South SudanSri LankaSt. Kitts and NevisSt. LuciaSt. Vincent and the GrenadinesSub-Saharan Africa Sub-Saharan Africa (excluding high income)Sub-Saharan Africa (IDA & IBRD countries)SudanSurinameSwazilandSyrian Arab RepublicTajikistanTanzaniaThailandTimor-LesteTogoTongaTrinidad and TobagoTunisiaTurkeyTurkmenistanTuvaluUgandaUkraineUpper middle incomeUruguayUzbekistanVanuatuVenezuela, RBVietnamWest Bank and GazaWorldYemen, Rep.ZambiaZimbabwe Timeline:
This timeline shows a graph from 1967 to 2015 of Uruguay. No data until 1966. Number of actual observations by date: 49.
Source name:
World Development Indicators
Source organization:
Development Assistance Committee of the Organisation for Economic Co-operation and Development, Geographical Distribution of Financial Flows to Developing Countries, Development Co-operation Report, and International Development Statistics database. Data are available online at: www.oecd.org/dac/stats/idsonline. World Bank GNI estimates are used for the denominator.
Categories, topics:
Aid Effectiveness, Economy & Growth, External Debt
Last updated:
apr 23, 2017
Indicators value changes by year
At the date of observation
Value
Absolute change
Change from previous value
jan 1, 1967
0.618
+0.618
0.0%
jan 1, 1968
0.37
-0.248
-40.15%
jan 1, 1969
2.853
+2.483
671.63%
jan 1, 1970
0.815
-2.039
-71.45%
jan 1, 1971
0.497
-0.318
-39.04%
jan 1, 1972
0.337
-0.16
-32.24%
jan 1, 1973
1.052
+0.716
212.72%
jan 1, 1974
0.531
-0.521
-49.52%
jan 1, 1975
0.278
-0.253
-47.7%
jan 1, 1976
0.344
+0.066
23.89%
jan 1, 1977
0.365
+0.021
6.08%
jan 1, 1978
0.422
+0.056
15.45%
jan 1, 1979
0.21
-0.211
-50.13%
jan 1, 1980
0.195
-0.015
-7.23%
jan 1, 1981
0.099
-0.096
-49.42%
jan 1, 1982
0.065
-0.034
-34.56%
jan 1, 1983
0.04
-0.025
-38.28%
jan 1, 1984
0.052
+0.012
30.94%
jan 1, 1985
0.085
+0.033
62.86%
jan 1, 1986
0.109
+0.024
28.78%
jan 1, 1987
0.473
+0.364
332.3%
jan 1, 1988
0.249
-0.224
-47.39%
jan 1, 1989
0.515
+0.266
107.11%
jan 1, 1990
0.475
-0.041
-7.87%
jan 1, 1991
0.585
+0.11
23.25%
jan 1, 1992
0.446
-0.139
-23.75%
jan 1, 1993
0.544
+0.098
21.9%
jan 1, 1994
0.758
+0.215
39.46%
jan 1, 1995
0.424
-0.334
-44.08%
jan 1, 1996
0.346
-0.078
-18.5%
jan 1, 1997
0.169
-0.176
-51.01%
jan 1, 1998
0.144
-0.025
-15.04%
jan 1, 1999
0.096
-0.048
-33.35%
jan 1, 2000
0.092
-0.004
-4.29%
jan 1, 2001
0.076
-0.015
-16.69%
jan 1, 2002
0.073
-0.004
-4.63%
jan 1, 2003
0.1
+0.027
37.49%
jan 1, 2004
0.204
+0.104
103.53%
jan 1, 2005
0.222
+0.018
8.71%
jan 1, 2006
0.086
-0.136
-61.4%
jan 1, 2007
0.11
+0.024
28.54%
jan 1, 2008
0.162
+0.052
46.88%
jan 1, 2009
0.113
-0.049
-30.1%
jan 1, 2010
0.163
+0.05
44.58%
jan 1, 2011
0.12
-0.043
-26.31%
jan 1, 2012
0.048
-0.072
-59.88%
jan 1, 2013
0.039
-0.009
-19.57%
jan 1, 2014
0.065
+0.026
66.38%
jan 1, 2015
0.161
+0.096
148.54%
Ranking of countries by current statistics by years


Comments: