29
/
en
AIzaSyAYiBZKx7MnpbEhh9jyipgxe19OcubqV5w
April 1, 2024
121260
Dominica
DMA
true
2
1
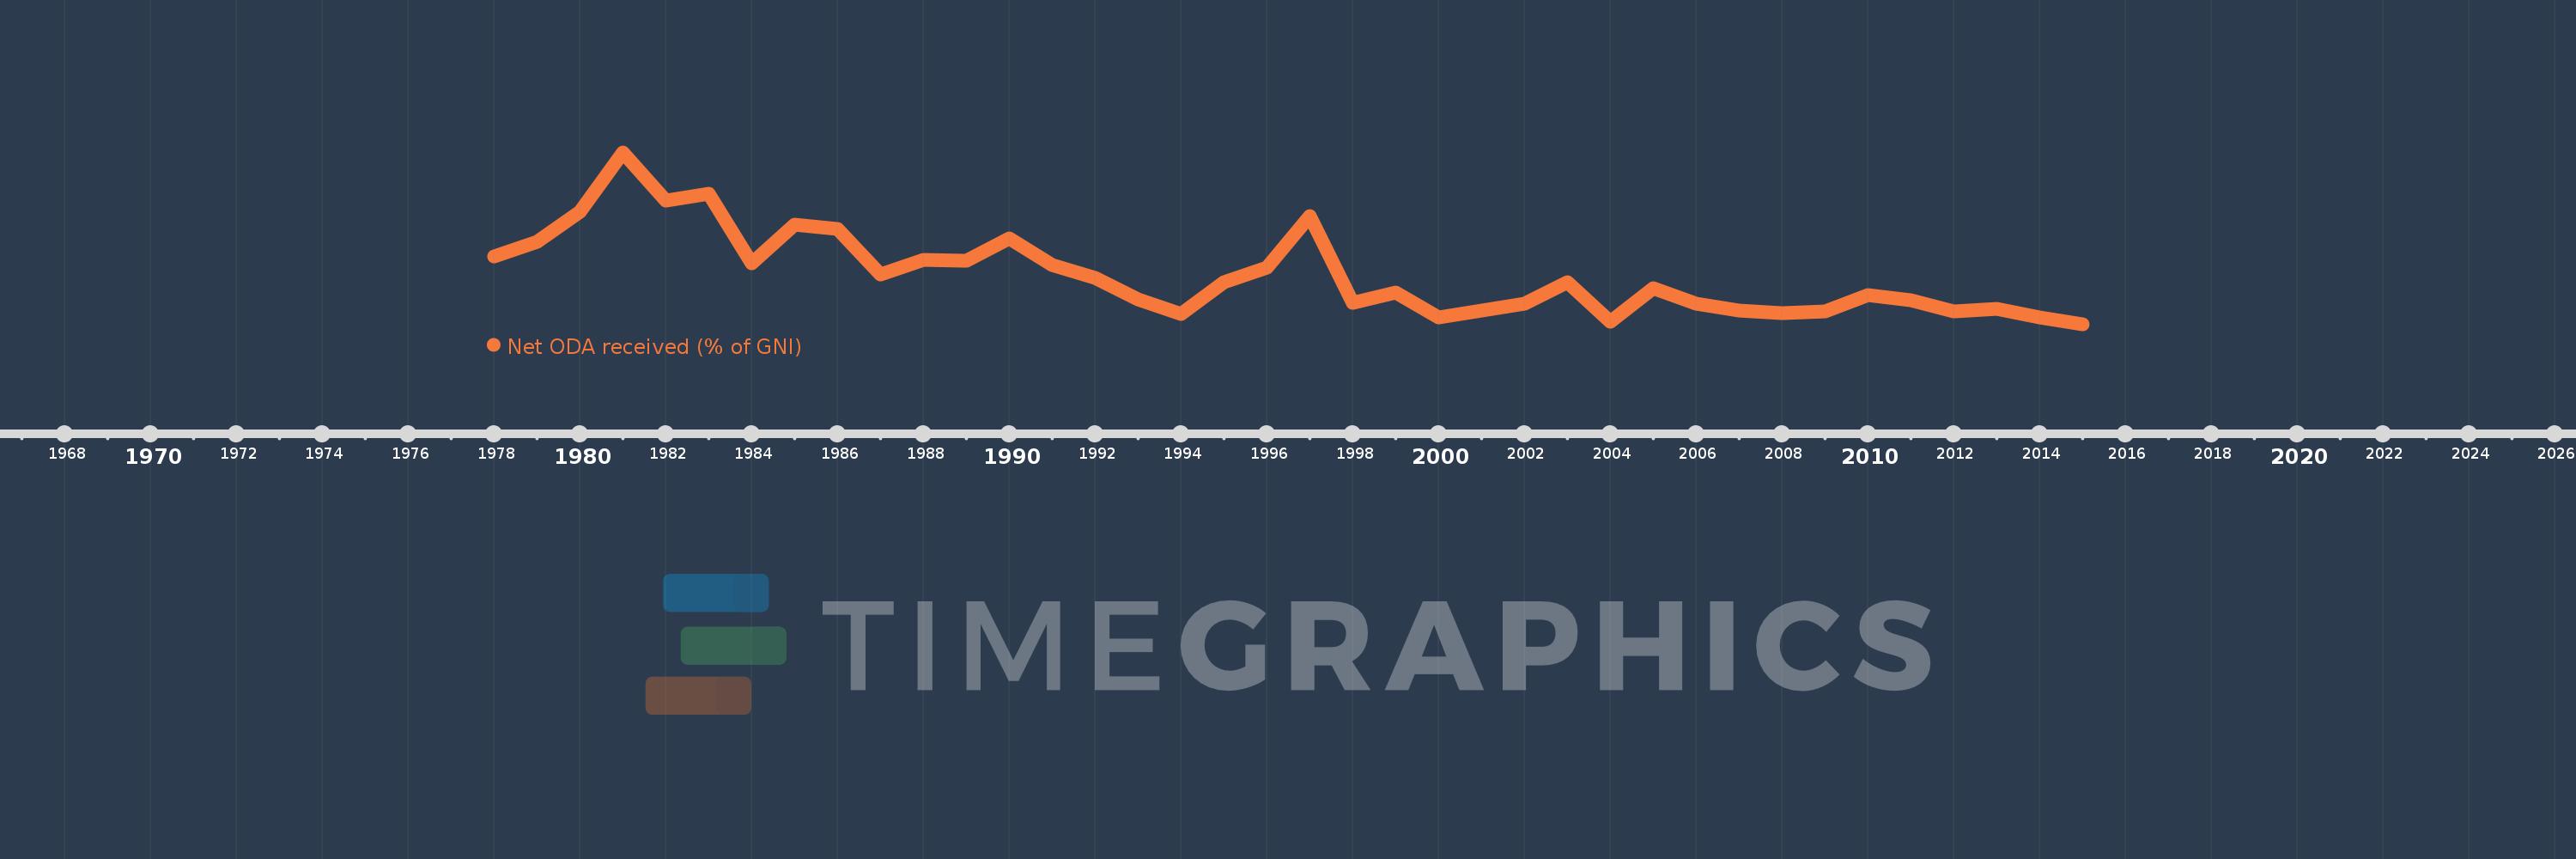
Net ODA received (% of GNI)
2015,2014,2013,2012,2011,2010,2009,2008,2007,2006,2005,2004,2003,2002,2001,2000,1999,1998,1997,1996,1995,1994,1993,1992,1991,1990,1989,1988,1987,1986,1985,1984,1983,1982,1981,1980,1979,1978
This statistics in other country:
AfghanistanAlbaniaAlgeriaAngolaAntigua and BarbudaArab WorldArgentinaArmeniaAzerbaijanBahamas, TheBahrainBangladeshBarbadosBelarusBelizeBeninBermudaBhutanBoliviaBosnia and HerzegovinaBotswanaBrazilBrunei DarussalamBurkina FasoBurundiCabo VerdeCambodiaCameroonCaribbean small statesCentral African RepublicCentral Europe and the BalticsChadChileChinaColombiaComorosCongo, Dem. Rep.Congo, Rep.Costa RicaCote d'IvoireCroatiaCubaCyprusDjiboutiDominicaDominican RepublicEast Asia & PacificEast Asia & Pacific (excluding high income)East Asia & Pacific (IDA & IBRD countries)EcuadorEgypt, Arab Rep.El SalvadorEquatorial GuineaEritreaEthiopiaEuro areaEurope & Central AsiaEurope & Central Asia (excluding high income)Europe & Central Asia (IDA & IBRD countries)European UnionFijiFragile and conflict affected situationsFrench PolynesiaGabonGambia, TheGeorgiaGhanaGrenadaGuatemalaGuineaGuinea-BissauGuyanaHaitiHeavily indebted poor countries (HIPC)High incomeHondurasHong Kong SAR, ChinaIBRD onlyIDA & IBRD totalIDA blendIDA onlyIDA totalIndiaIndonesiaIran, Islamic Rep.IraqIsraelJamaicaJordanKazakhstanKenyaKiribatiKorea, Rep.KosovoKuwaitKyrgyz RepublicLao PDRLatin America & Caribbean Latin America & Caribbean (excluding high income)Latin America & the Caribbean (IDA & IBRD countries)Least developed countries: UN classificationLebanonLesothoLiberiaLibyaLow & middle incomeLow incomeLower middle incomeMacao SAR, ChinaMacedonia, FYRMadagascarMalawiMalaysiaMaldivesMaliMaltaMarshall IslandsMauritaniaMauritiusMexicoMicronesia, Fed. Sts.Middle East & North AfricaMiddle East & North Africa (excluding high income)Middle East & North Africa (IDA & IBRD countries)Middle incomeMoldovaMongoliaMontenegroMoroccoMozambiqueMyanmarNamibiaNauruNepalNew CaledoniaNicaraguaNigerNigeriaNorth AmericaOECD membersOmanOther small statesPacific island small statesPakistanPalauPanamaPapua New GuineaParaguayPeruPhilippinesQatarRwandaSamoaSao Tome and PrincipeSaudi ArabiaSenegalSerbiaSeychellesSierra LeoneSingaporeSloveniaSmall statesSolomon IslandsSomaliaSouth AfricaSouth AsiaSouth Asia (IDA & IBRD)South SudanSri LankaSt. Kitts and NevisSt. LuciaSt. Vincent and the GrenadinesSub-Saharan Africa Sub-Saharan Africa (excluding high income)Sub-Saharan Africa (IDA & IBRD countries)SudanSurinameSwazilandSyrian Arab RepublicTajikistanTanzaniaThailandTimor-LesteTogoTongaTrinidad and TobagoTunisiaTurkeyTurkmenistanTuvaluUgandaUkraineUpper middle incomeUruguayUzbekistanVanuatuVenezuela, RBVietnamWest Bank and GazaWorldYemen, Rep.ZambiaZimbabwe Timeline:
This timeline shows a graph from 1978 to 2015 of Dominica. No data until 1977. Number of actual observations by date: 38.
Source name:
World Development Indicators
Source organization:
Development Assistance Committee of the Organisation for Economic Co-operation and Development, Geographical Distribution of Financial Flows to Developing Countries, Development Co-operation Report, and International Development Statistics database. Data are available online at: www.oecd.org/dac/stats/idsonline. World Bank GNI estimates are used for the denominator.
Categories, topics:
Aid Effectiveness, Economy & Growth, External Debt
Last updated:
apr 23, 2017
Indicators value changes by year
Maximum:
29.646
jan 1, 1981
At the date of observation
Value
Absolute change
Change from previous value
jan 1, 1978
13.61
+13.61
0.0%
jan 1, 1979
15.81
+2.2
16.17%
jan 1, 1980
20.482
+4.672
29.55%
jan 1, 1981
29.646
+9.164
44.74%
jan 1, 1982
22.123
-7.524
-25.38%
jan 1, 1983
23.197
+1.074
4.85%
jan 1, 1984
12.474
-10.723
-46.23%
jan 1, 1985
18.443
+5.969
47.85%
jan 1, 1986
17.765
-0.678
-3.67%
jan 1, 1987
10.696
-7.069
-39.79%
jan 1, 1988
13.065
+2.369
22.15%
jan 1, 1989
12.82
-0.245
-1.87%
jan 1, 1990
16.323
+3.503
27.32%
jan 1, 1991
12.17
-4.153
-25.44%
jan 1, 1992
10.204
-1.966
-16.15%
jan 1, 1993
6.887
-3.317
-32.51%
jan 1, 1994
4.592
-2.296
-33.33%
jan 1, 1995
9.582
+4.991
108.69%
jan 1, 1996
11.866
+2.284
23.83%
jan 1, 1997
19.812
+7.946
66.96%
jan 1, 1998
6.361
-13.451
-67.89%
jan 1, 1999
7.926
+1.565
24.6%
jan 1, 2000
4.063
-3.863
-48.74%
jan 1, 2001
5.123
+1.06
26.09%
jan 1, 2002
6.192
+1.069
20.87%
jan 1, 2003
9.556
+3.364
54.33%
jan 1, 2004
3.457
-6.098
-63.82%
jan 1, 2005
8.622
+5.165
149.39%
jan 1, 2006
6.185
-2.438
-28.27%
jan 1, 2007
5.199
-0.986
-15.94%
jan 1, 2008
4.831
-0.368
-7.08%
jan 1, 2009
5.049
+0.218
4.52%
jan 1, 2010
7.562
+2.512
49.75%
jan 1, 2011
6.699
-0.862
-11.41%
jan 1, 2012
5.02
-1.679
-25.07%
jan 1, 2013
5.487
+0.467
9.3%
jan 1, 2014
4.049
-1.438
-26.21%
jan 1, 2015
3.053
-0.996
-24.61%
Ranking of countries by current statistics by years


Comments: