29
/
en
AIzaSyAYiBZKx7MnpbEhh9jyipgxe19OcubqV5w
April 1, 2024
90169
Botswana
BWA
true
2
1
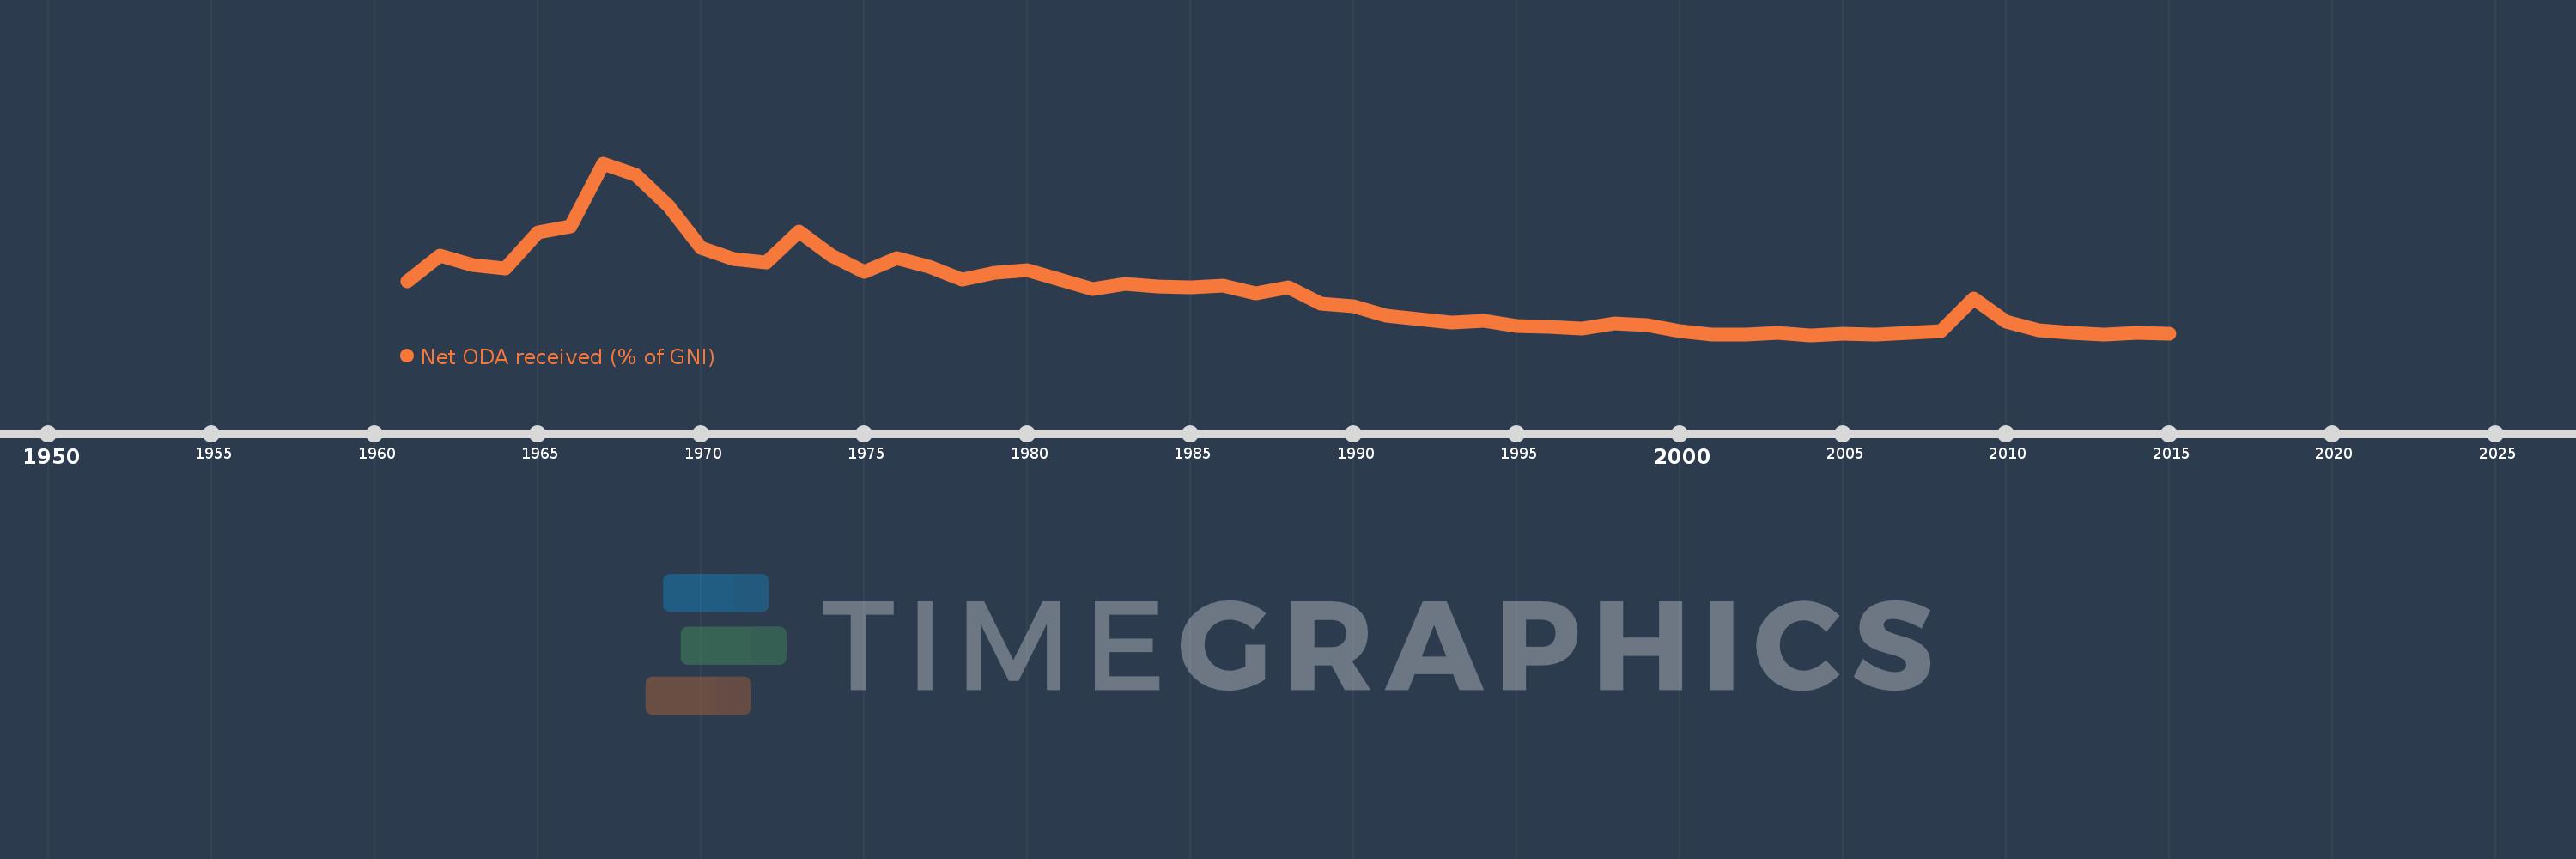
Net ODA received (% of GNI)
2015,2014,2013,2012,2011,2010,2009,2008,2007,2006,2005,2004,2003,2002,2001,2000,1999,1998,1997,1996,1995,1994,1993,1992,1991,1990,1989,1988,1987,1986,1985,1984,1983,1982,1981,1980,1979,1978,1977,1976,1975,1974,1973,1972,1971,1970,1969,1968,1967,1966,1965,1964,1963,1962,1961
This statistics in other country:
AfghanistanAlbaniaAlgeriaAngolaAntigua and BarbudaArab WorldArgentinaArmeniaAzerbaijanBahamas, TheBahrainBangladeshBarbadosBelarusBelizeBeninBermudaBhutanBoliviaBosnia and HerzegovinaBotswanaBrazilBrunei DarussalamBurkina FasoBurundiCabo VerdeCambodiaCameroonCaribbean small statesCentral African RepublicCentral Europe and the BalticsChadChileChinaColombiaComorosCongo, Dem. Rep.Congo, Rep.Costa RicaCote d'IvoireCroatiaCubaCyprusDjiboutiDominicaDominican RepublicEast Asia & PacificEast Asia & Pacific (excluding high income)East Asia & Pacific (IDA & IBRD countries)EcuadorEgypt, Arab Rep.El SalvadorEquatorial GuineaEritreaEthiopiaEuro areaEurope & Central AsiaEurope & Central Asia (excluding high income)Europe & Central Asia (IDA & IBRD countries)European UnionFijiFragile and conflict affected situationsFrench PolynesiaGabonGambia, TheGeorgiaGhanaGrenadaGuatemalaGuineaGuinea-BissauGuyanaHaitiHeavily indebted poor countries (HIPC)High incomeHondurasHong Kong SAR, ChinaIBRD onlyIDA & IBRD totalIDA blendIDA onlyIDA totalIndiaIndonesiaIran, Islamic Rep.IraqIsraelJamaicaJordanKazakhstanKenyaKiribatiKorea, Rep.KosovoKuwaitKyrgyz RepublicLao PDRLatin America & Caribbean Latin America & Caribbean (excluding high income)Latin America & the Caribbean (IDA & IBRD countries)Least developed countries: UN classificationLebanonLesothoLiberiaLibyaLow & middle incomeLow incomeLower middle incomeMacao SAR, ChinaMacedonia, FYRMadagascarMalawiMalaysiaMaldivesMaliMaltaMarshall IslandsMauritaniaMauritiusMexicoMicronesia, Fed. Sts.Middle East & North AfricaMiddle East & North Africa (excluding high income)Middle East & North Africa (IDA & IBRD countries)Middle incomeMoldovaMongoliaMontenegroMoroccoMozambiqueMyanmarNamibiaNauruNepalNew CaledoniaNicaraguaNigerNigeriaNorth AmericaOECD membersOmanOther small statesPacific island small statesPakistanPalauPanamaPapua New GuineaParaguayPeruPhilippinesQatarRwandaSamoaSao Tome and PrincipeSaudi ArabiaSenegalSerbiaSeychellesSierra LeoneSingaporeSloveniaSmall statesSolomon IslandsSomaliaSouth AfricaSouth AsiaSouth Asia (IDA & IBRD)South SudanSri LankaSt. Kitts and NevisSt. LuciaSt. Vincent and the GrenadinesSub-Saharan Africa Sub-Saharan Africa (excluding high income)Sub-Saharan Africa (IDA & IBRD countries)SudanSurinameSwazilandSyrian Arab RepublicTajikistanTanzaniaThailandTimor-LesteTogoTongaTrinidad and TobagoTunisiaTurkeyTurkmenistanTuvaluUgandaUkraineUpper middle incomeUruguayUzbekistanVanuatuVenezuela, RBVietnamWest Bank and GazaWorldYemen, Rep.ZambiaZimbabwe Timeline:
This timeline shows a graph from 1961 to 2015 of Botswana. No data until 1960. Number of actual observations by date: 55.
Source name:
World Development Indicators
Source organization:
Development Assistance Committee of the Organisation for Economic Co-operation and Development, Geographical Distribution of Financial Flows to Developing Countries, Development Co-operation Report, and International Development Statistics database. Data are available online at: www.oecd.org/dac/stats/idsonline. World Bank GNI estimates are used for the denominator.
Categories, topics:
Aid Effectiveness, Economy & Growth, External Debt
Last updated:
apr 23, 2017
Indicators value changes by year
Maximum:
31.382
jan 1, 1967
At the date of observation
Value
Absolute change
Change from previous value
jan 1, 1961
10.028
+10.028
0.0%
jan 1, 1962
14.777
+4.749
47.36%
jan 1, 1963
13.107
-1.67
-11.3%
jan 1, 1964
12.449
-0.658
-5.02%
jan 1, 1965
18.971
+6.522
52.39%
jan 1, 1966
20.022
+1.052
5.54%
jan 1, 1967
31.382
+11.36
56.74%
jan 1, 1968
29.324
-2.058
-6.56%
jan 1, 1969
23.791
-5.533
-18.87%
jan 1, 1970
16.191
-7.6
-31.94%
jan 1, 1971
14.105
-2.086
-12.88%
jan 1, 1972
13.534
-0.572
-4.05%
jan 1, 1973
19.008
+5.474
40.45%
jan 1, 1974
14.758
-4.25
-22.36%
jan 1, 1975
11.78
-2.978
-20.18%
jan 1, 1976
14.342
+2.563
21.75%
jan 1, 1977
12.736
-1.607
-11.2%
jan 1, 1978
10.462
-2.273
-17.85%
jan 1, 1979
11.648
+1.186
11.33%
jan 1, 1980
12.125
+0.477
4.1%
jan 1, 1981
10.381
-1.744
-14.38%
jan 1, 1982
8.681
-1.701
-16.38%
jan 1, 1983
9.691
+1.01
11.64%
jan 1, 1984
9.105
-0.586
-6.04%
jan 1, 1985
9.046
-0.059
-0.64%
jan 1, 1986
9.39
+0.344
3.8%
jan 1, 1987
7.851
-1.538
-16.38%
jan 1, 1988
8.955
+1.103
14.05%
jan 1, 1989
6.07
-2.885
-32.22%
jan 1, 1990
5.606
-0.463
-7.64%
jan 1, 1991
3.941
-1.665
-29.7%
jan 1, 1992
3.272
-0.669
-16.97%
jan 1, 1993
2.612
-0.66
-20.16%
jan 1, 1994
2.917
+0.304
11.65%
jan 1, 1995
2.111
-0.806
-27.62%
jan 1, 1996
1.906
-0.205
-9.72%
jan 1, 1997
1.62
-0.285
-14.98%
jan 1, 1998
2.492
+0.872
53.8%
jan 1, 1999
2.164
-0.328
-13.17%
jan 1, 2000
1.166
-0.998
-46.12%
jan 1, 2001
0.563
-0.603
-51.69%
jan 1, 2002
0.545
-0.018
-3.25%
jan 1, 2003
0.784
+0.24
43.95%
jan 1, 2004
0.41
-0.375
-47.76%
jan 1, 2005
0.627
+0.218
53.1%
jan 1, 2006
0.528
-0.1
-15.92%
jan 1, 2007
0.736
+0.208
39.45%
jan 1, 2008
1.055
+0.32
43.48%
jan 1, 2009
7.064
+6.008
569.26%
jan 1, 2010
2.783
-4.28
-60.6%
jan 1, 2011
1.254
-1.529
-54.94%
jan 1, 2012
0.761
-0.493
-39.32%
jan 1, 2013
0.495
-0.266
-34.98%
jan 1, 2014
0.743
+0.248
50.22%
jan 1, 2015
0.641
-0.102
-13.7%
Ranking of countries by current statistics by years


Comments: