29
/
en
AIzaSyAYiBZKx7MnpbEhh9jyipgxe19OcubqV5w
April 1, 2024
37626
IDA & IBRD total
IBT
false
2
1
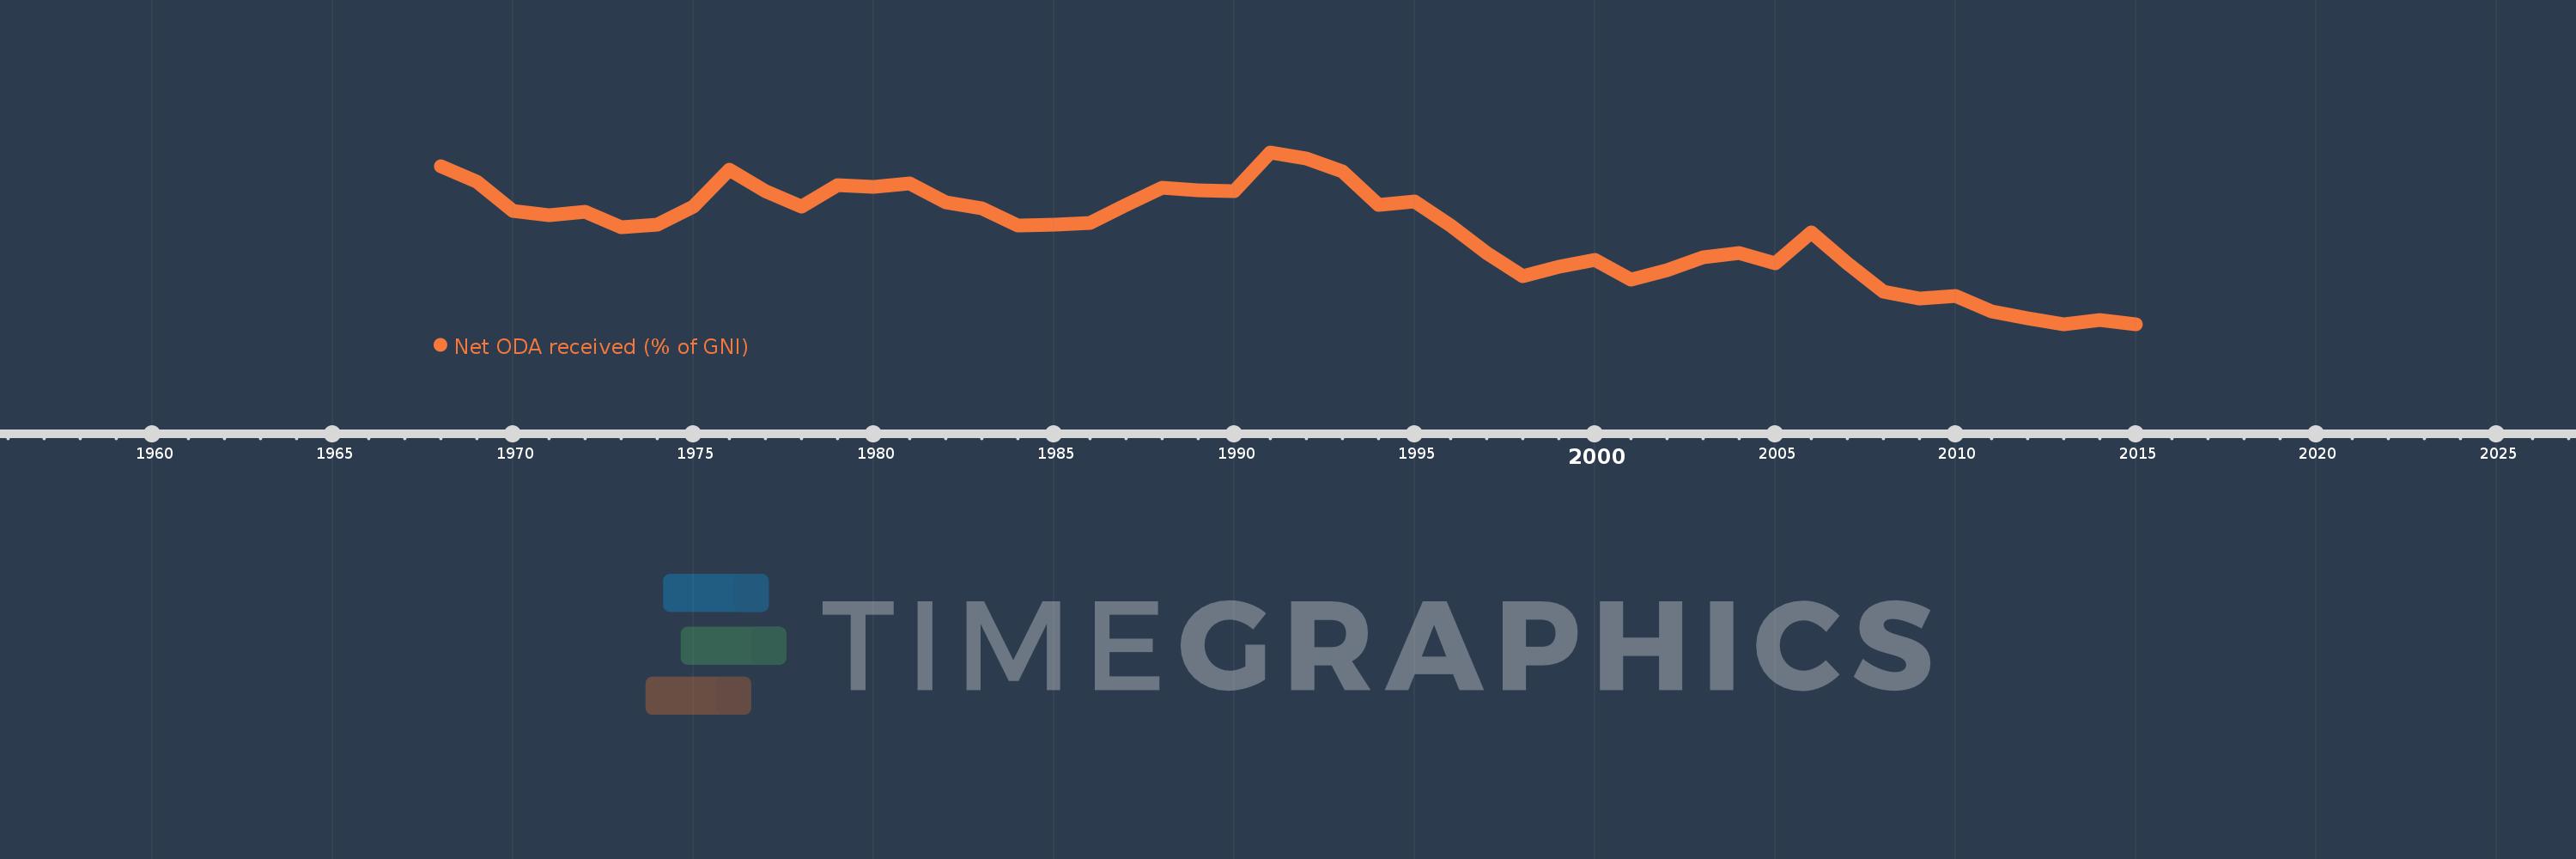
Net ODA received (% of GNI)
2015,2014,2013,2012,2011,2010,2009,2008,2007,2006,2005,2004,2003,2002,2001,2000,1999,1998,1997,1996,1995,1994,1993,1992,1991,1990,1989,1988,1987,1986,1985,1984,1983,1982,1981,1980,1979,1978,1977,1976,1975,1974,1973,1972,1971,1970,1969,1968
This statistics in other country:
AfghanistanAlbaniaAlgeriaAngolaAntigua and BarbudaArab WorldArgentinaArmeniaAzerbaijanBahamas, TheBahrainBangladeshBarbadosBelarusBelizeBeninBermudaBhutanBoliviaBosnia and HerzegovinaBotswanaBrazilBrunei DarussalamBurkina FasoBurundiCabo VerdeCambodiaCameroonCaribbean small statesCentral African RepublicCentral Europe and the BalticsChadChileChinaColombiaComorosCongo, Dem. Rep.Congo, Rep.Costa RicaCote d'IvoireCroatiaCubaCyprusDjiboutiDominicaDominican RepublicEast Asia & PacificEast Asia & Pacific (excluding high income)East Asia & Pacific (IDA & IBRD countries)EcuadorEgypt, Arab Rep.El SalvadorEquatorial GuineaEritreaEthiopiaEuro areaEurope & Central AsiaEurope & Central Asia (excluding high income)Europe & Central Asia (IDA & IBRD countries)European UnionFijiFragile and conflict affected situationsFrench PolynesiaGabonGambia, TheGeorgiaGhanaGrenadaGuatemalaGuineaGuinea-BissauGuyanaHaitiHeavily indebted poor countries (HIPC)High incomeHondurasHong Kong SAR, ChinaIBRD onlyIDA & IBRD totalIDA blendIDA onlyIDA totalIndiaIndonesiaIran, Islamic Rep.IraqIsraelJamaicaJordanKazakhstanKenyaKiribatiKorea, Rep.KosovoKuwaitKyrgyz RepublicLao PDRLatin America & Caribbean Latin America & Caribbean (excluding high income)Latin America & the Caribbean (IDA & IBRD countries)Least developed countries: UN classificationLebanonLesothoLiberiaLibyaLow & middle incomeLow incomeLower middle incomeMacao SAR, ChinaMacedonia, FYRMadagascarMalawiMalaysiaMaldivesMaliMaltaMarshall IslandsMauritaniaMauritiusMexicoMicronesia, Fed. Sts.Middle East & North AfricaMiddle East & North Africa (excluding high income)Middle East & North Africa (IDA & IBRD countries)Middle incomeMoldovaMongoliaMontenegroMoroccoMozambiqueMyanmarNamibiaNauruNepalNew CaledoniaNicaraguaNigerNigeriaNorth AmericaOECD membersOmanOther small statesPacific island small statesPakistanPalauPanamaPapua New GuineaParaguayPeruPhilippinesQatarRwandaSamoaSao Tome and PrincipeSaudi ArabiaSenegalSerbiaSeychellesSierra LeoneSingaporeSloveniaSmall statesSolomon IslandsSomaliaSouth AfricaSouth AsiaSouth Asia (IDA & IBRD)South SudanSri LankaSt. Kitts and NevisSt. LuciaSt. Vincent and the GrenadinesSub-Saharan Africa Sub-Saharan Africa (excluding high income)Sub-Saharan Africa (IDA & IBRD countries)SudanSurinameSwazilandSyrian Arab RepublicTajikistanTanzaniaThailandTimor-LesteTogoTongaTrinidad and TobagoTunisiaTurkeyTurkmenistanTuvaluUgandaUkraineUpper middle incomeUruguayUzbekistanVanuatuVenezuela, RBVietnamWest Bank and GazaWorldYemen, Rep.ZambiaZimbabwe Timeline:
This timeline shows a graph from 1968 to 2015 of IDA & IBRD total. No data until 1967. Number of actual observations by date: 48.
Source name:
World Development Indicators
Source organization:
Development Assistance Committee of the Organisation for Economic Co-operation and Development, Geographical Distribution of Financial Flows to Developing Countries, Development Co-operation Report, and International Development Statistics database. Data are available online at: www.oecd.org/dac/stats/idsonline. World Bank GNI estimates are used for the denominator.
Categories, topics:
Aid Effectiveness, Economy & Growth, External Debt
Last updated:
apr 23, 2017
Indicators value changes by year
At the date of observation
Value
Absolute change
Change from previous value
jan 1, 1968
1.217
+1.217
0.0%
jan 1, 1969
1.132
-0.085
-7.01%
jan 1, 1970
0.974
-0.158
-13.92%
jan 1, 1971
0.947
-0.027
-2.78%
jan 1, 1972
0.965
+0.017
1.84%
jan 1, 1973
0.88
-0.085
-8.77%
jan 1, 1974
0.897
+0.017
1.92%
jan 1, 1975
0.994
+0.097
10.81%
jan 1, 1976
1.201
+0.207
20.81%
jan 1, 1977
1.082
-0.119
-9.91%
jan 1, 1978
0.996
-0.086
-7.94%
jan 1, 1979
1.113
+0.117
11.76%
jan 1, 1980
1.104
-0.009
-0.78%
jan 1, 1981
1.123
+0.019
1.74%
jan 1, 1982
1.02
-0.103
-9.17%
jan 1, 1983
0.986
-0.035
-3.39%
jan 1, 1984
0.889
-0.097
-9.81%
jan 1, 1985
0.895
+0.006
0.7%
jan 1, 1986
0.906
+0.011
1.17%
jan 1, 1987
1.006
+0.1
11.04%
jan 1, 1988
1.099
+0.093
9.28%
jan 1, 1989
1.087
-0.012
-1.13%
jan 1, 1990
1.079
-0.008
-0.72%
jan 1, 1991
1.295
+0.216
20.04%
jan 1, 1992
1.262
-0.033
-2.51%
jan 1, 1993
1.192
-0.07
-5.55%
jan 1, 1994
1.005
-0.187
-15.72%
jan 1, 1995
1.024
+0.019
1.91%
jan 1, 1996
0.893
-0.131
-12.77%
jan 1, 1997
0.738
-0.155
-17.38%
jan 1, 1998
0.611
-0.127
-17.22%
jan 1, 1999
0.665
+0.054
8.79%
jan 1, 2000
0.702
+0.038
5.67%
jan 1, 2001
0.594
-0.108
-15.35%
jan 1, 2002
0.645
+0.05
8.48%
jan 1, 2003
0.714
+0.07
10.78%
jan 1, 2004
0.741
+0.027
3.79%
jan 1, 2005
0.681
-0.06
-8.13%
jan 1, 2006
0.855
+0.173
25.45%
jan 1, 2007
0.681
-0.173
-20.3%
jan 1, 2008
0.526
-0.155
-22.71%
jan 1, 2009
0.49
-0.036
-6.83%
jan 1, 2010
0.501
+0.01
2.11%
jan 1, 2011
0.415
-0.086
-17.08%
jan 1, 2012
0.38
-0.035
-8.48%
jan 1, 2013
0.346
-0.034
-8.83%
jan 1, 2014
0.367
+0.021
5.93%
jan 1, 2015
0.346
-0.021
-5.76%
Ranking of countries by current statistics by years


Comments: