29
/
en
AIzaSyAYiBZKx7MnpbEhh9jyipgxe19OcubqV5w
April 1, 2024
250143
St. Kitts and Nevis
KNA
true
2
1
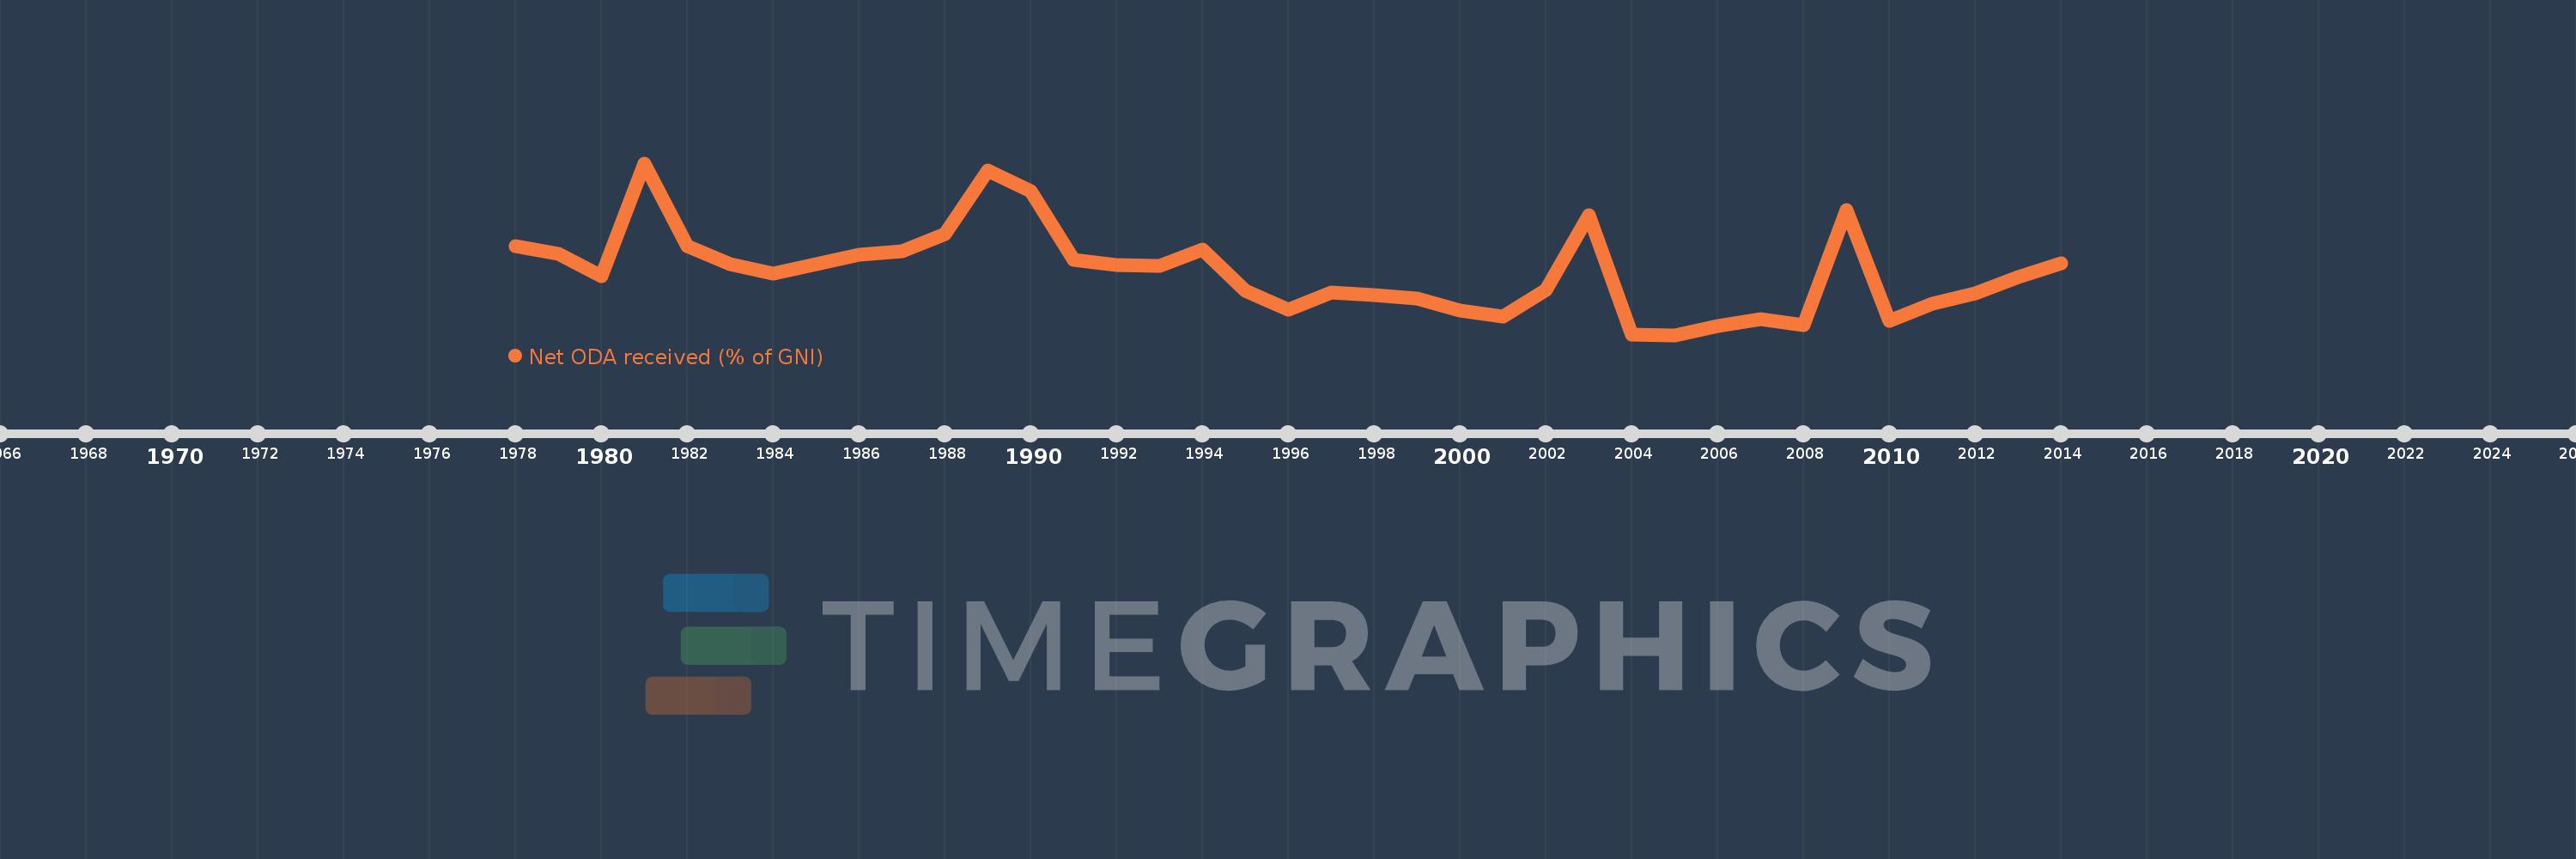
Net ODA received (% of GNI)
2014,2013,2012,2011,2010,2009,2008,2007,2006,2005,2004,2003,2002,2001,2000,1999,1998,1997,1996,1995,1994,1993,1992,1991,1990,1989,1988,1987,1986,1985,1984,1983,1982,1981,1980,1979,1978
This statistics in other country:
AfghanistanAlbaniaAlgeriaAngolaAntigua and BarbudaArab WorldArgentinaArmeniaAzerbaijanBahamas, TheBahrainBangladeshBarbadosBelarusBelizeBeninBermudaBhutanBoliviaBosnia and HerzegovinaBotswanaBrazilBrunei DarussalamBurkina FasoBurundiCabo VerdeCambodiaCameroonCaribbean small statesCentral African RepublicCentral Europe and the BalticsChadChileChinaColombiaComorosCongo, Dem. Rep.Congo, Rep.Costa RicaCote d'IvoireCroatiaCubaCyprusDjiboutiDominicaDominican RepublicEast Asia & PacificEast Asia & Pacific (excluding high income)East Asia & Pacific (IDA & IBRD countries)EcuadorEgypt, Arab Rep.El SalvadorEquatorial GuineaEritreaEthiopiaEuro areaEurope & Central AsiaEurope & Central Asia (excluding high income)Europe & Central Asia (IDA & IBRD countries)European UnionFijiFragile and conflict affected situationsFrench PolynesiaGabonGambia, TheGeorgiaGhanaGrenadaGuatemalaGuineaGuinea-BissauGuyanaHaitiHeavily indebted poor countries (HIPC)High incomeHondurasHong Kong SAR, ChinaIBRD onlyIDA & IBRD totalIDA blendIDA onlyIDA totalIndiaIndonesiaIran, Islamic Rep.IraqIsraelJamaicaJordanKazakhstanKenyaKiribatiKorea, Rep.KosovoKuwaitKyrgyz RepublicLao PDRLatin America & Caribbean Latin America & Caribbean (excluding high income)Latin America & the Caribbean (IDA & IBRD countries)Least developed countries: UN classificationLebanonLesothoLiberiaLibyaLow & middle incomeLow incomeLower middle incomeMacao SAR, ChinaMacedonia, FYRMadagascarMalawiMalaysiaMaldivesMaliMaltaMarshall IslandsMauritaniaMauritiusMexicoMicronesia, Fed. Sts.Middle East & North AfricaMiddle East & North Africa (excluding high income)Middle East & North Africa (IDA & IBRD countries)Middle incomeMoldovaMongoliaMontenegroMoroccoMozambiqueMyanmarNamibiaNauruNepalNew CaledoniaNicaraguaNigerNigeriaNorth AmericaOECD membersOmanOther small statesPacific island small statesPakistanPalauPanamaPapua New GuineaParaguayPeruPhilippinesQatarRwandaSamoaSao Tome and PrincipeSaudi ArabiaSenegalSerbiaSeychellesSierra LeoneSingaporeSloveniaSmall statesSolomon IslandsSomaliaSouth AfricaSouth AsiaSouth Asia (IDA & IBRD)South SudanSri LankaSt. Kitts and NevisSt. LuciaSt. Vincent and the GrenadinesSub-Saharan Africa Sub-Saharan Africa (excluding high income)Sub-Saharan Africa (IDA & IBRD countries)SudanSurinameSwazilandSyrian Arab RepublicTajikistanTanzaniaThailandTimor-LesteTogoTongaTrinidad and TobagoTunisiaTurkeyTurkmenistanTuvaluUgandaUkraineUpper middle incomeUruguayUzbekistanVanuatuVenezuela, RBVietnamWest Bank and GazaWorldYemen, Rep.ZambiaZimbabwe Timeline:
This timeline shows a graph from 1978 to 2014 of St. Kitts and Nevis. No data until 1977. Number of actual observations by date: 37.
Source name:
World Development Indicators
Source organization:
Development Assistance Committee of the Organisation for Economic Co-operation and Development, Geographical Distribution of Financial Flows to Developing Countries, Development Co-operation Report, and International Development Statistics database. Data are available online at: www.oecd.org/dac/stats/idsonline. World Bank GNI estimates are used for the denominator.
Categories, topics:
Aid Effectiveness, Economy & Growth, External Debt
Last updated:
apr 23, 2017
Indicators value changes by year
At the date of observation
Value
Absolute change
Change from previous value
jan 1, 1978
4.702
+4.702
0.0%
jan 1, 1979
4.289
-0.413
-8.79%
jan 1, 1980
3.105
-1.184
-27.6%
jan 1, 1981
9.104
+5.998
193.17%
jan 1, 1982
4.723
-4.38
-48.11%
jan 1, 1983
3.748
-0.976
-20.65%
jan 1, 1984
3.279
-0.469
-12.5%
jan 1, 1985
3.753
+0.473
14.44%
jan 1, 1986
4.248
+0.495
13.19%
jan 1, 1987
4.459
+0.211
4.96%
jan 1, 1988
5.364
+0.906
20.32%
jan 1, 1989
8.718
+3.353
62.51%
jan 1, 1990
7.638
-1.08
-12.39%
jan 1, 1991
3.975
-3.663
-47.96%
jan 1, 1992
3.702
-0.273
-6.87%
jan 1, 1993
3.689
-0.013
-0.34%
jan 1, 1994
4.529
+0.84
22.78%
jan 1, 1995
2.347
-2.182
-48.18%
jan 1, 1996
1.351
-0.997
-42.46%
jan 1, 1997
2.253
+0.902
66.8%
jan 1, 1998
2.141
-0.112
-4.95%
jan 1, 1999
1.943
-0.198
-9.24%
jan 1, 2000
1.292
-0.652
-33.53%
jan 1, 2001
1.0
-0.292
-22.58%
jan 1, 2002
2.379
+1.379
137.85%
jan 1, 2003
6.347
+3.968
166.82%
jan 1, 2004
0.038
-6.309
-99.4%
jan 1, 2005
0.009
-0.029
-77.31%
jan 1, 2006
0.492
+0.483
5.59K%
jan 1, 2007
0.855
+0.363
73.68%
jan 1, 2008
0.535
-0.32
-37.41%
jan 1, 2009
6.64
+6.105
1.14K%
jan 1, 2010
0.744
-5.896
-88.79%
jan 1, 2011
1.69
+0.945
127.04%
jan 1, 2012
2.218
+0.528
31.28%
jan 1, 2013
3.083
+0.865
38.99%
jan 1, 2014
3.79
+0.707
22.95%
Ranking of countries by current statistics by years


Comments: