29
/
en
AIzaSyAYiBZKx7MnpbEhh9jyipgxe19OcubqV5w
April 1, 2024
112648
Costa Rica
CRI
true
2
1
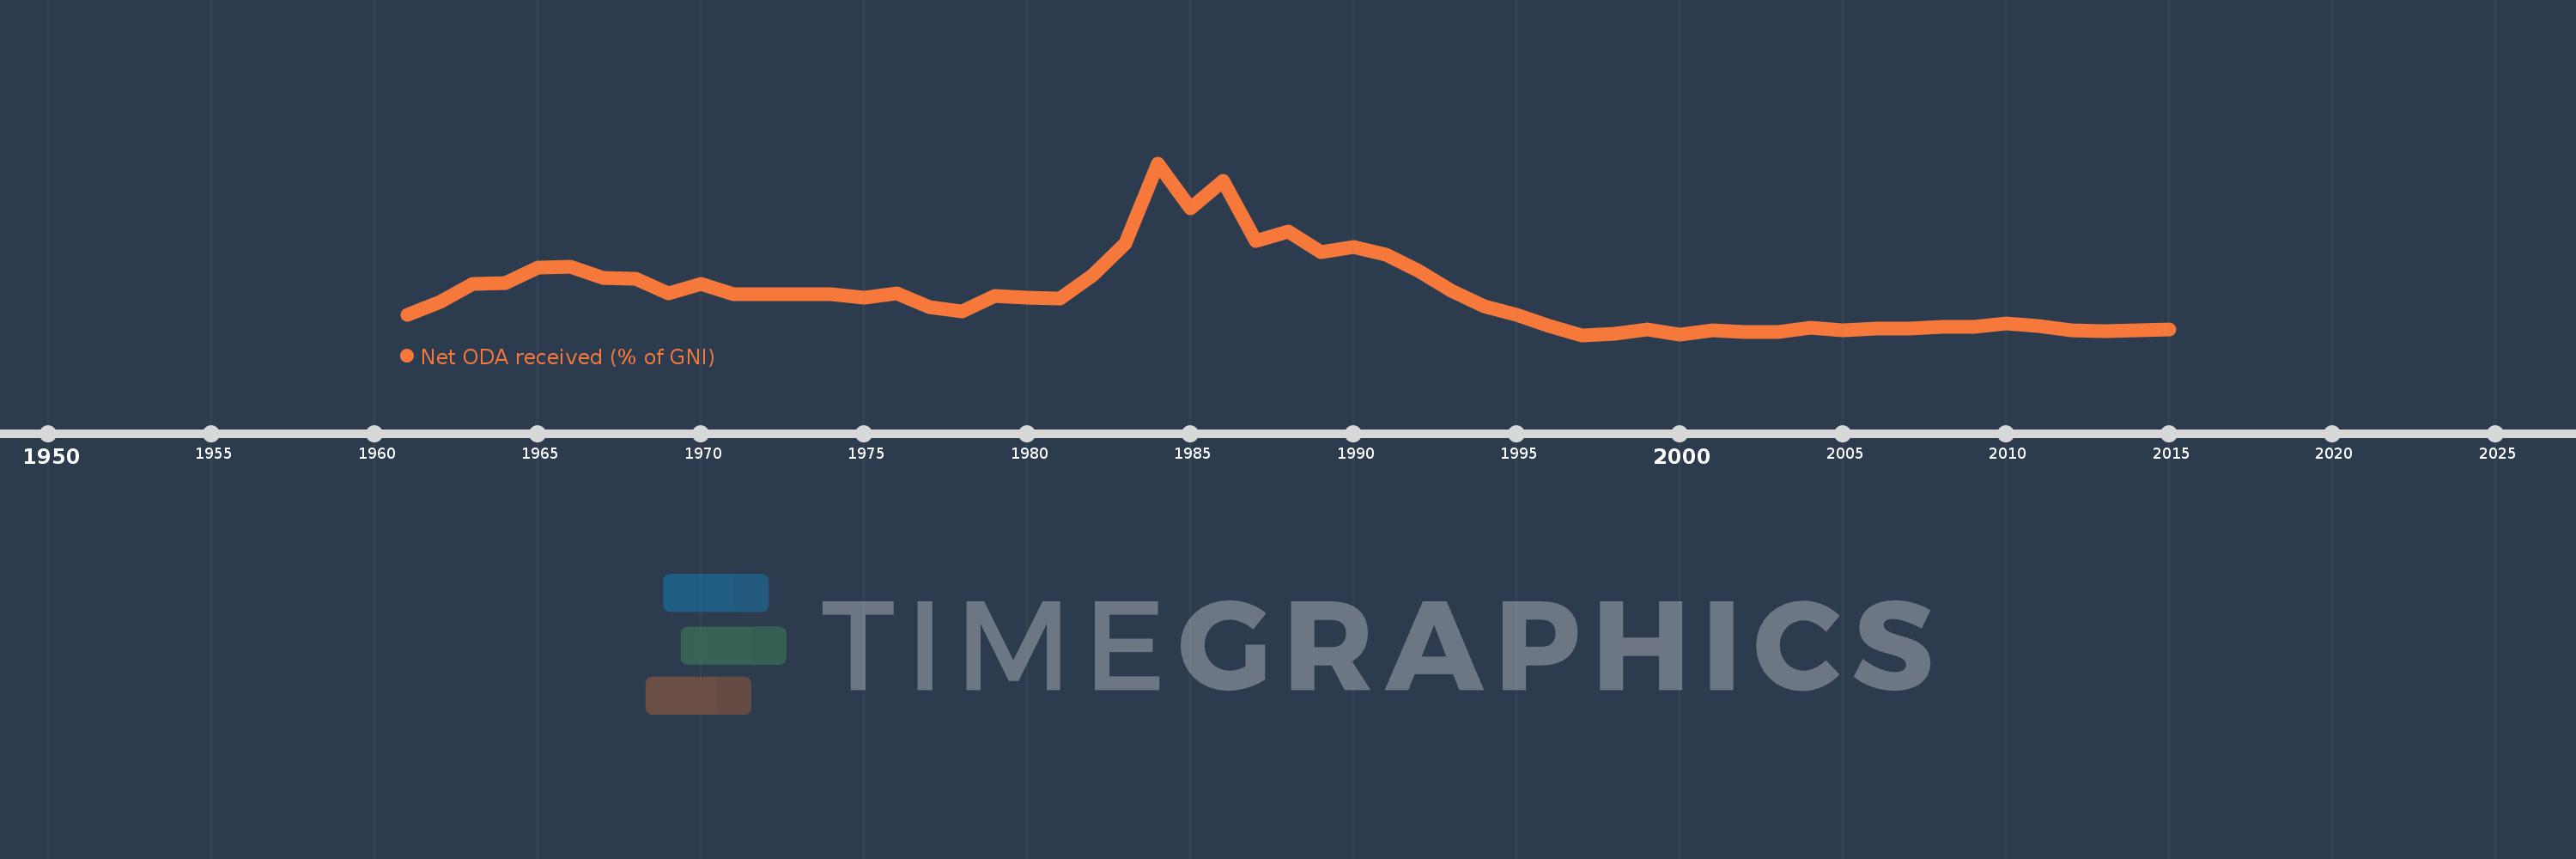
Net ODA received (% of GNI)
2015,2014,2013,2012,2011,2010,2009,2008,2007,2006,2005,2004,2003,2002,2001,2000,1999,1998,1997,1996,1995,1994,1993,1992,1991,1990,1989,1988,1987,1986,1985,1984,1983,1982,1981,1980,1979,1978,1977,1976,1975,1974,1973,1972,1971,1970,1969,1968,1967,1966,1965,1964,1963,1962,1961
This statistics in other country:
AfghanistanAlbaniaAlgeriaAngolaAntigua and BarbudaArab WorldArgentinaArmeniaAzerbaijanBahamas, TheBahrainBangladeshBarbadosBelarusBelizeBeninBermudaBhutanBoliviaBosnia and HerzegovinaBotswanaBrazilBrunei DarussalamBurkina FasoBurundiCabo VerdeCambodiaCameroonCaribbean small statesCentral African RepublicCentral Europe and the BalticsChadChileChinaColombiaComorosCongo, Dem. Rep.Congo, Rep.Costa RicaCote d'IvoireCroatiaCubaCyprusDjiboutiDominicaDominican RepublicEast Asia & PacificEast Asia & Pacific (excluding high income)East Asia & Pacific (IDA & IBRD countries)EcuadorEgypt, Arab Rep.El SalvadorEquatorial GuineaEritreaEthiopiaEuro areaEurope & Central AsiaEurope & Central Asia (excluding high income)Europe & Central Asia (IDA & IBRD countries)European UnionFijiFragile and conflict affected situationsFrench PolynesiaGabonGambia, TheGeorgiaGhanaGrenadaGuatemalaGuineaGuinea-BissauGuyanaHaitiHeavily indebted poor countries (HIPC)High incomeHondurasHong Kong SAR, ChinaIBRD onlyIDA & IBRD totalIDA blendIDA onlyIDA totalIndiaIndonesiaIran, Islamic Rep.IraqIsraelJamaicaJordanKazakhstanKenyaKiribatiKorea, Rep.KosovoKuwaitKyrgyz RepublicLao PDRLatin America & Caribbean Latin America & Caribbean (excluding high income)Latin America & the Caribbean (IDA & IBRD countries)Least developed countries: UN classificationLebanonLesothoLiberiaLibyaLow & middle incomeLow incomeLower middle incomeMacao SAR, ChinaMacedonia, FYRMadagascarMalawiMalaysiaMaldivesMaliMaltaMarshall IslandsMauritaniaMauritiusMexicoMicronesia, Fed. Sts.Middle East & North AfricaMiddle East & North Africa (excluding high income)Middle East & North Africa (IDA & IBRD countries)Middle incomeMoldovaMongoliaMontenegroMoroccoMozambiqueMyanmarNamibiaNauruNepalNew CaledoniaNicaraguaNigerNigeriaNorth AmericaOECD membersOmanOther small statesPacific island small statesPakistanPalauPanamaPapua New GuineaParaguayPeruPhilippinesQatarRwandaSamoaSao Tome and PrincipeSaudi ArabiaSenegalSerbiaSeychellesSierra LeoneSingaporeSloveniaSmall statesSolomon IslandsSomaliaSouth AfricaSouth AsiaSouth Asia (IDA & IBRD)South SudanSri LankaSt. Kitts and NevisSt. LuciaSt. Vincent and the GrenadinesSub-Saharan Africa Sub-Saharan Africa (excluding high income)Sub-Saharan Africa (IDA & IBRD countries)SudanSurinameSwazilandSyrian Arab RepublicTajikistanTanzaniaThailandTimor-LesteTogoTongaTrinidad and TobagoTunisiaTurkeyTurkmenistanTuvaluUgandaUkraineUpper middle incomeUruguayUzbekistanVanuatuVenezuela, RBVietnamWest Bank and GazaWorldYemen, Rep.ZambiaZimbabwe Timeline:
This timeline shows a graph from 1961 to 2015 of Costa Rica. No data until 1960. Number of actual observations by date: 55.
Source name:
World Development Indicators
Source organization:
Development Assistance Committee of the Organisation for Economic Co-operation and Development, Geographical Distribution of Financial Flows to Developing Countries, Development Co-operation Report, and International Development Statistics database. Data are available online at: www.oecd.org/dac/stats/idsonline. World Bank GNI estimates are used for the denominator.
Categories, topics:
Aid Effectiveness, Economy & Growth, External Debt
Last updated:
apr 23, 2017
Indicators value changes by year
Minimum:
-0.112
jan 1, 1997
At the date of observation
Value
Absolute change
Change from previous value
jan 1, 1961
0.714
+0.714
0.0%
jan 1, 1962
1.247
+0.533
74.69%
jan 1, 1963
1.98
+0.733
58.76%
jan 1, 1964
2.011
+0.031
1.58%
jan 1, 1965
2.628
+0.617
30.66%
jan 1, 1966
2.679
+0.051
1.94%
jan 1, 1967
2.236
-0.443
-16.53%
jan 1, 1968
2.188
-0.048
-2.16%
jan 1, 1969
1.578
-0.61
-27.87%
jan 1, 1970
1.971
+0.393
24.87%
jan 1, 1971
1.549
-0.422
-21.4%
jan 1, 1972
1.556
+0.007
0.48%
jan 1, 1973
1.551
-0.006
-0.36%
jan 1, 1974
1.566
+0.016
1.01%
jan 1, 1975
1.416
-0.15
-9.59%
jan 1, 1976
1.585
+0.169
11.9%
jan 1, 1977
1.042
-0.543
-34.28%
jan 1, 1978
0.842
-0.2
-19.19%
jan 1, 1979
1.484
+0.642
76.33%
jan 1, 1980
1.421
-0.063
-4.27%
jan 1, 1981
1.396
-0.025
-1.75%
jan 1, 1982
2.321
+0.925
66.25%
jan 1, 1983
3.628
+1.307
56.32%
jan 1, 1984
6.904
+3.276
90.31%
jan 1, 1985
5.057
-1.847
-26.75%
jan 1, 1986
6.187
+1.129
22.33%
jan 1, 1987
3.739
-2.448
-39.56%
jan 1, 1988
4.108
+0.369
9.88%
jan 1, 1989
3.274
-0.834
-20.31%
jan 1, 1990
3.498
+0.224
6.84%
jan 1, 1991
3.174
-0.324
-9.26%
jan 1, 1992
2.488
-0.686
-21.61%
jan 1, 1993
1.685
-0.803
-32.29%
jan 1, 1994
1.063
-0.622
-36.91%
jan 1, 1995
0.725
-0.338
-31.76%
jan 1, 1996
0.263
-0.463
-63.77%
jan 1, 1997
-0.112
-0.375
-142.69%
jan 1, 1998
-0.065
+0.048
-42.41%
jan 1, 1999
0.13
+0.195
-301.14%
jan 1, 2000
-0.08
-0.21
-161.31%
jan 1, 2001
0.068
+0.147
-184.8%
jan 1, 2002
0.002
-0.065
-96.39%
jan 1, 2003
-0.002
-0.005
-188.6%
jan 1, 2004
0.177
+0.179
-8.29K%
jan 1, 2005
0.072
-0.105
-59.31%
jan 1, 2006
0.135
+0.063
87.07%
jan 1, 2007
0.145
+0.01
7.45%
jan 1, 2008
0.223
+0.078
53.62%
jan 1, 2009
0.221
-0.002
-0.91%
jan 1, 2010
0.368
+0.148
66.92%
jan 1, 2011
0.261
-0.107
-29.18%
jan 1, 2012
0.088
-0.173
-66.42%
jan 1, 2013
0.063
-0.025
-28.12%
jan 1, 2014
0.07
+0.007
10.75%
jan 1, 2015
0.111
+0.042
59.71%
Ranking of countries by current statistics by years


Comments: