29
/
en
AIzaSyAYiBZKx7MnpbEhh9jyipgxe19OcubqV5w
April 1, 2024
132354
Fiji
FJI
true
2
1
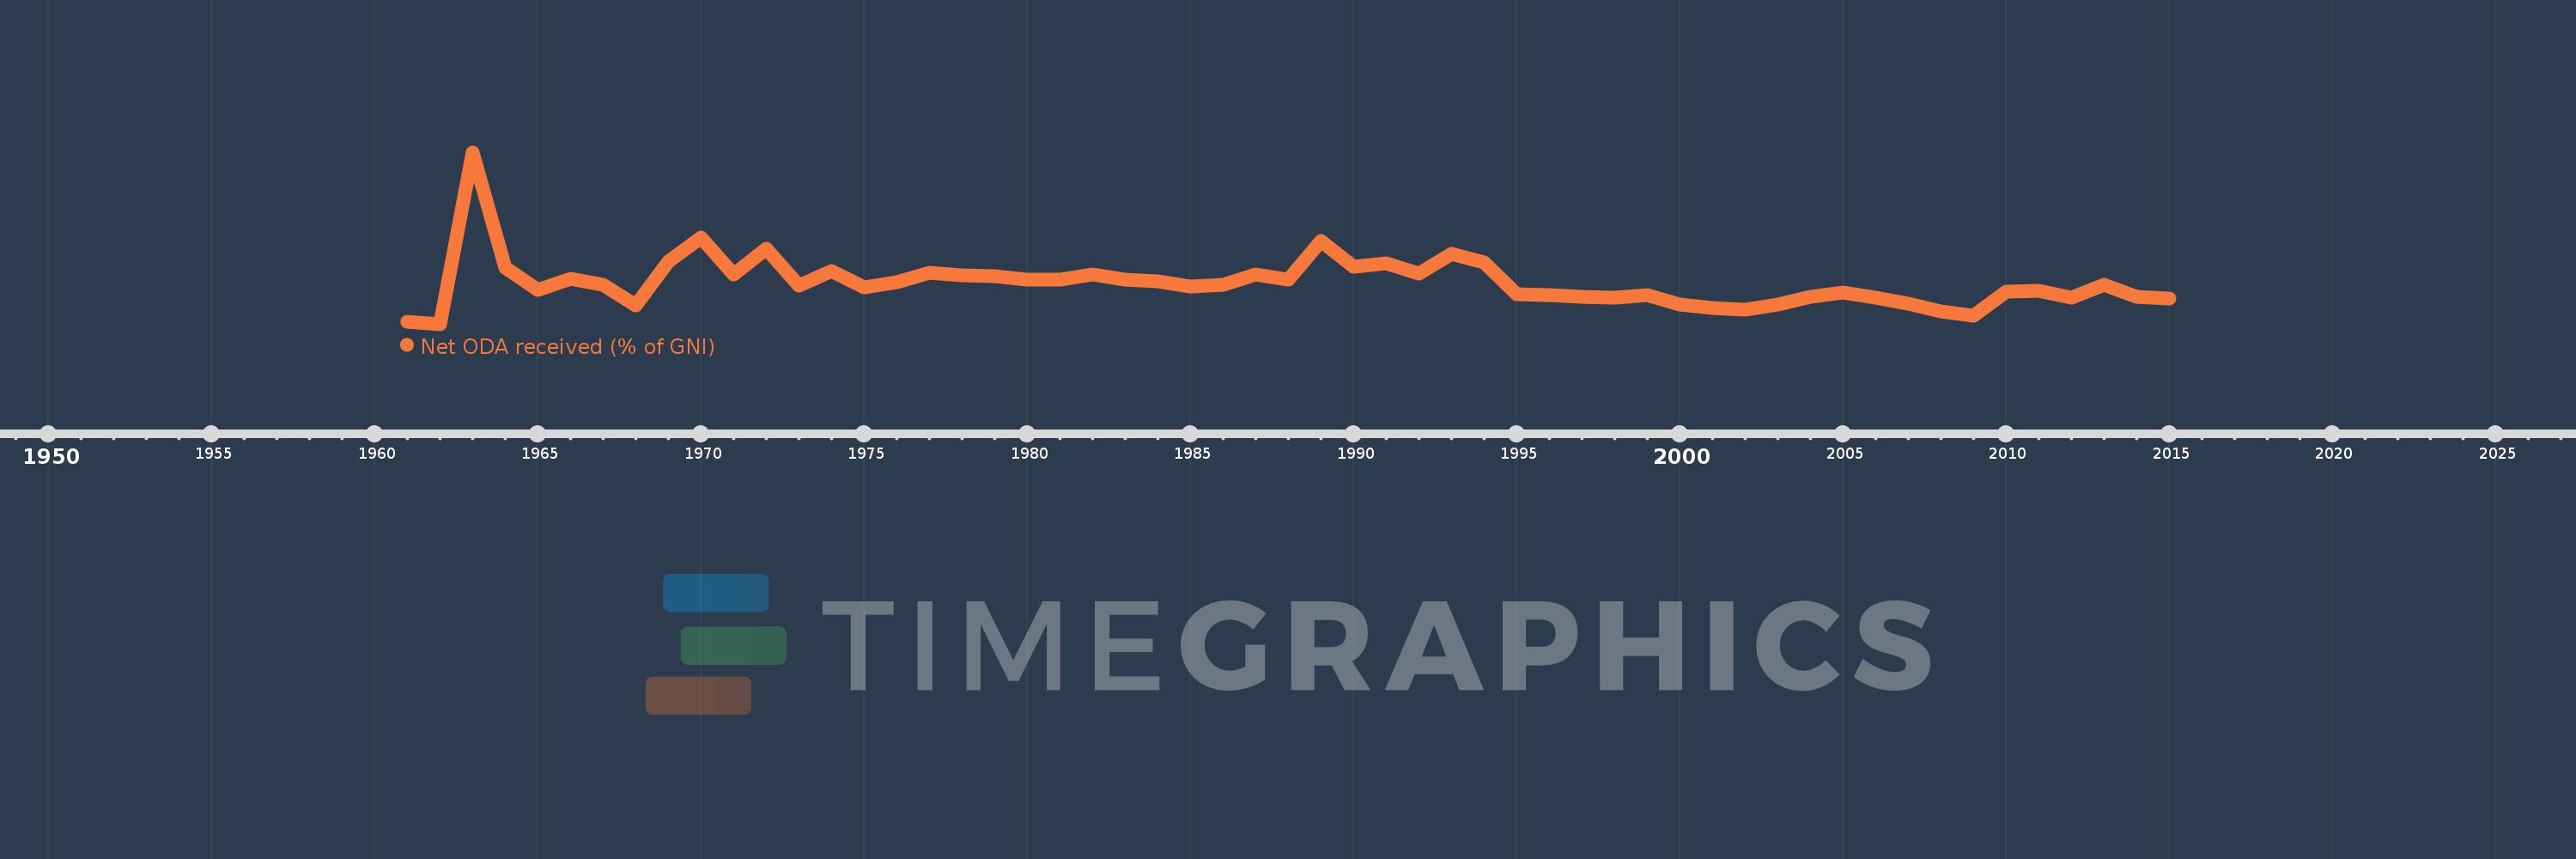
Net ODA received (% of GNI)
2015,2014,2013,2012,2011,2010,2009,2008,2007,2006,2005,2004,2003,2002,2001,2000,1999,1998,1997,1996,1995,1994,1993,1992,1991,1990,1989,1988,1987,1986,1985,1984,1983,1982,1981,1980,1979,1978,1977,1976,1975,1974,1973,1972,1971,1970,1969,1968,1967,1966,1965,1964,1963,1962,1961
This statistics in other country:
AfghanistanAlbaniaAlgeriaAngolaAntigua and BarbudaArab WorldArgentinaArmeniaAzerbaijanBahamas, TheBahrainBangladeshBarbadosBelarusBelizeBeninBermudaBhutanBoliviaBosnia and HerzegovinaBotswanaBrazilBrunei DarussalamBurkina FasoBurundiCabo VerdeCambodiaCameroonCaribbean small statesCentral African RepublicCentral Europe and the BalticsChadChileChinaColombiaComorosCongo, Dem. Rep.Congo, Rep.Costa RicaCote d'IvoireCroatiaCubaCyprusDjiboutiDominicaDominican RepublicEast Asia & PacificEast Asia & Pacific (excluding high income)East Asia & Pacific (IDA & IBRD countries)EcuadorEgypt, Arab Rep.El SalvadorEquatorial GuineaEritreaEthiopiaEuro areaEurope & Central AsiaEurope & Central Asia (excluding high income)Europe & Central Asia (IDA & IBRD countries)European UnionFijiFragile and conflict affected situationsFrench PolynesiaGabonGambia, TheGeorgiaGhanaGrenadaGuatemalaGuineaGuinea-BissauGuyanaHaitiHeavily indebted poor countries (HIPC)High incomeHondurasHong Kong SAR, ChinaIBRD onlyIDA & IBRD totalIDA blendIDA onlyIDA totalIndiaIndonesiaIran, Islamic Rep.IraqIsraelJamaicaJordanKazakhstanKenyaKiribatiKorea, Rep.KosovoKuwaitKyrgyz RepublicLao PDRLatin America & Caribbean Latin America & Caribbean (excluding high income)Latin America & the Caribbean (IDA & IBRD countries)Least developed countries: UN classificationLebanonLesothoLiberiaLibyaLow & middle incomeLow incomeLower middle incomeMacao SAR, ChinaMacedonia, FYRMadagascarMalawiMalaysiaMaldivesMaliMaltaMarshall IslandsMauritaniaMauritiusMexicoMicronesia, Fed. Sts.Middle East & North AfricaMiddle East & North Africa (excluding high income)Middle East & North Africa (IDA & IBRD countries)Middle incomeMoldovaMongoliaMontenegroMoroccoMozambiqueMyanmarNamibiaNauruNepalNew CaledoniaNicaraguaNigerNigeriaNorth AmericaOECD membersOmanOther small statesPacific island small statesPakistanPalauPanamaPapua New GuineaParaguayPeruPhilippinesQatarRwandaSamoaSao Tome and PrincipeSaudi ArabiaSenegalSerbiaSeychellesSierra LeoneSingaporeSloveniaSmall statesSolomon IslandsSomaliaSouth AfricaSouth AsiaSouth Asia (IDA & IBRD)South SudanSri LankaSt. Kitts and NevisSt. LuciaSt. Vincent and the GrenadinesSub-Saharan Africa Sub-Saharan Africa (excluding high income)Sub-Saharan Africa (IDA & IBRD countries)SudanSurinameSwazilandSyrian Arab RepublicTajikistanTanzaniaThailandTimor-LesteTogoTongaTrinidad and TobagoTunisiaTurkeyTurkmenistanTuvaluUgandaUkraineUpper middle incomeUruguayUzbekistanVanuatuVenezuela, RBVietnamWest Bank and GazaWorldYemen, Rep.ZambiaZimbabwe Timeline:
This timeline shows a graph from 1961 to 2015 of Fiji. No data until 1960. Number of actual observations by date: 55.
Source name:
World Development Indicators
Source organization:
Development Assistance Committee of the Organisation for Economic Co-operation and Development, Geographical Distribution of Financial Flows to Developing Countries, Development Co-operation Report, and International Development Statistics database. Data are available online at: www.oecd.org/dac/stats/idsonline. World Bank GNI estimates are used for the denominator.
Categories, topics:
Aid Effectiveness, Economy & Growth, External Debt
Last updated:
apr 23, 2017
Indicators value changes by year
At the date of observation
Value
Absolute change
Change from previous value
jan 1, 1962
0.897
-0.102
-10.25%
jan 1, 1963
9.16
+8.263
921.03%
jan 1, 1964
3.608
-5.552
-60.61%
jan 1, 1965
2.532
-1.076
-29.83%
jan 1, 1966
3.094
+0.562
22.21%
jan 1, 1967
2.799
-0.295
-9.53%
jan 1, 1968
1.798
-1.001
-35.77%
jan 1, 1969
3.902
+2.104
117.0%
jan 1, 1970
5.054
+1.152
29.52%
jan 1, 1971
3.307
-1.747
-34.56%
jan 1, 1972
4.51
+1.203
36.38%
jan 1, 1973
2.769
-1.74
-38.59%
jan 1, 1974
3.468
+0.698
25.22%
jan 1, 1975
2.669
-0.798
-23.03%
jan 1, 1976
2.897
+0.227
8.52%
jan 1, 1977
3.39
+0.494
17.04%
jan 1, 1978
3.249
-0.142
-4.18%
jan 1, 1979
3.194
-0.054
-1.67%
jan 1, 1980
3.051
-0.143
-4.48%
jan 1, 1981
3.028
-0.024
-0.78%
jan 1, 1982
3.286
+0.259
8.55%
jan 1, 1983
3.026
-0.261
-7.94%
jan 1, 1984
2.963
-0.062
-2.06%
jan 1, 1985
2.698
-0.265
-8.95%
jan 1, 1986
2.787
+0.089
3.29%
jan 1, 1987
3.283
+0.496
17.8%
jan 1, 1988
3.042
-0.241
-7.34%
jan 1, 1989
4.917
+1.876
61.66%
jan 1, 1990
3.67
-1.248
-25.37%
jan 1, 1991
3.845
+0.175
4.77%
jan 1, 1992
3.334
-0.511
-13.29%
jan 1, 1993
4.28
+0.946
28.39%
jan 1, 1994
3.872
-0.408
-9.54%
jan 1, 1995
2.335
-1.537
-39.69%
jan 1, 1996
2.299
-0.036
-1.53%
jan 1, 1997
2.227
-0.073
-3.15%
jan 1, 1998
2.161
-0.066
-2.95%
jan 1, 1999
2.3
+0.139
6.42%
jan 1, 2000
1.857
-0.442
-19.23%
jan 1, 2001
1.696
-0.162
-8.71%
jan 1, 2002
1.575
-0.12
-7.1%
jan 1, 2003
1.853
+0.278
17.64%
jan 1, 2004
2.206
+0.353
19.07%
jan 1, 2005
2.403
+0.197
8.93%
jan 1, 2006
2.168
-0.235
-9.77%
jan 1, 2007
1.866
-0.302
-13.94%
jan 1, 2008
1.526
-0.34
-18.23%
jan 1, 2009
1.317
-0.209
-13.71%
jan 1, 2010
2.483
+1.166
88.54%
jan 1, 2011
2.514
+0.031
1.23%
jan 1, 2012
2.153
-0.361
-14.35%
jan 1, 2013
2.799
+0.646
30.01%
jan 1, 2014
2.217
-0.582
-20.8%
jan 1, 2015
2.133
-0.084
-3.78%
Ranking of countries by current statistics by years


Comments: