29
/
en
AIzaSyAYiBZKx7MnpbEhh9jyipgxe19OcubqV5w
April 1, 2024
155009
India
IND
true
2
1
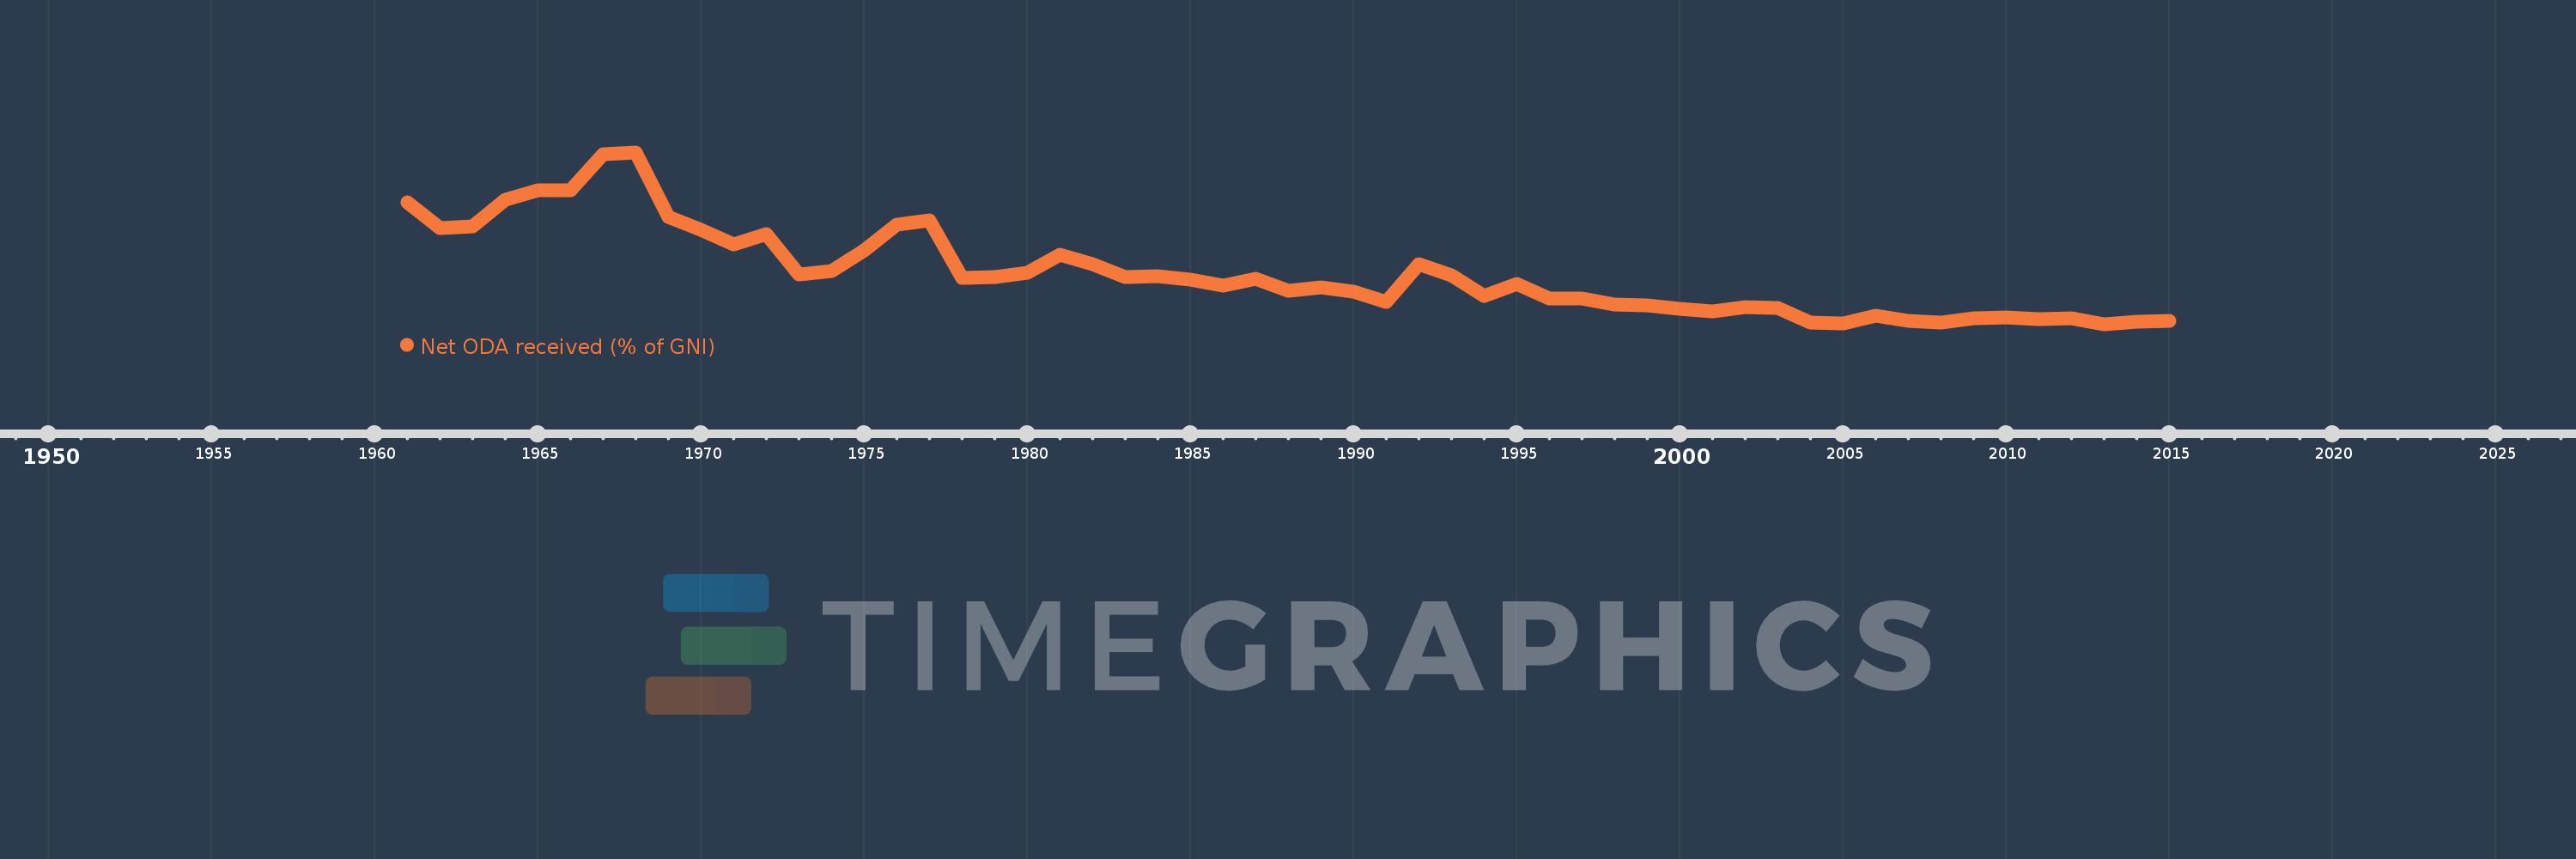
Net ODA received (% of GNI)
2015,2014,2013,2012,2011,2010,2009,2008,2007,2006,2005,2004,2003,2002,2001,2000,1999,1998,1997,1996,1995,1994,1993,1992,1991,1990,1989,1988,1987,1986,1985,1984,1983,1982,1981,1980,1979,1978,1977,1976,1975,1974,1973,1972,1971,1970,1969,1968,1967,1966,1965,1964,1963,1962,1961
This statistics in other country:
AfghanistanAlbaniaAlgeriaAngolaAntigua and BarbudaArab WorldArgentinaArmeniaAzerbaijanBahamas, TheBahrainBangladeshBarbadosBelarusBelizeBeninBermudaBhutanBoliviaBosnia and HerzegovinaBotswanaBrazilBrunei DarussalamBurkina FasoBurundiCabo VerdeCambodiaCameroonCaribbean small statesCentral African RepublicCentral Europe and the BalticsChadChileChinaColombiaComorosCongo, Dem. Rep.Congo, Rep.Costa RicaCote d'IvoireCroatiaCubaCyprusDjiboutiDominicaDominican RepublicEast Asia & PacificEast Asia & Pacific (excluding high income)East Asia & Pacific (IDA & IBRD countries)EcuadorEgypt, Arab Rep.El SalvadorEquatorial GuineaEritreaEthiopiaEuro areaEurope & Central AsiaEurope & Central Asia (excluding high income)Europe & Central Asia (IDA & IBRD countries)European UnionFijiFragile and conflict affected situationsFrench PolynesiaGabonGambia, TheGeorgiaGhanaGrenadaGuatemalaGuineaGuinea-BissauGuyanaHaitiHeavily indebted poor countries (HIPC)High incomeHondurasHong Kong SAR, ChinaIBRD onlyIDA & IBRD totalIDA blendIDA onlyIDA totalIndiaIndonesiaIran, Islamic Rep.IraqIsraelJamaicaJordanKazakhstanKenyaKiribatiKorea, Rep.KosovoKuwaitKyrgyz RepublicLao PDRLatin America & Caribbean Latin America & Caribbean (excluding high income)Latin America & the Caribbean (IDA & IBRD countries)Least developed countries: UN classificationLebanonLesothoLiberiaLibyaLow & middle incomeLow incomeLower middle incomeMacao SAR, ChinaMacedonia, FYRMadagascarMalawiMalaysiaMaldivesMaliMaltaMarshall IslandsMauritaniaMauritiusMexicoMicronesia, Fed. Sts.Middle East & North AfricaMiddle East & North Africa (excluding high income)Middle East & North Africa (IDA & IBRD countries)Middle incomeMoldovaMongoliaMontenegroMoroccoMozambiqueMyanmarNamibiaNauruNepalNew CaledoniaNicaraguaNigerNigeriaNorth AmericaOECD membersOmanOther small statesPacific island small statesPakistanPalauPanamaPapua New GuineaParaguayPeruPhilippinesQatarRwandaSamoaSao Tome and PrincipeSaudi ArabiaSenegalSerbiaSeychellesSierra LeoneSingaporeSloveniaSmall statesSolomon IslandsSomaliaSouth AfricaSouth AsiaSouth Asia (IDA & IBRD)South SudanSri LankaSt. Kitts and NevisSt. LuciaSt. Vincent and the GrenadinesSub-Saharan Africa Sub-Saharan Africa (excluding high income)Sub-Saharan Africa (IDA & IBRD countries)SudanSurinameSwazilandSyrian Arab RepublicTajikistanTanzaniaThailandTimor-LesteTogoTongaTrinidad and TobagoTunisiaTurkeyTurkmenistanTuvaluUgandaUkraineUpper middle incomeUruguayUzbekistanVanuatuVenezuela, RBVietnamWest Bank and GazaWorldYemen, Rep.ZambiaZimbabwe Timeline:
This timeline shows a graph from 1961 to 2015 of India. No data until 1960. Number of actual observations by date: 55.
Source name:
World Development Indicators
Source organization:
Development Assistance Committee of the Organisation for Economic Co-operation and Development, Geographical Distribution of Financial Flows to Developing Countries, Development Co-operation Report, and International Development Statistics database. Data are available online at: www.oecd.org/dac/stats/idsonline. World Bank GNI estimates are used for the denominator.
Categories, topics:
Aid Effectiveness, Economy & Growth, External Debt
Last updated:
apr 23, 2017
Indicators value changes by year
At the date of observation
Value
Absolute change
Change from previous value
jan 1, 1961
1.944
+1.944
0.0%
jan 1, 1962
1.553
-0.392
-20.15%
jan 1, 1963
1.587
+0.035
2.22%
jan 1, 1964
1.993
+0.406
25.6%
jan 1, 1965
2.127
+0.134
6.71%
jan 1, 1966
2.131
+0.004
0.19%
jan 1, 1967
2.677
+0.545
25.59%
jan 1, 1968
2.709
+0.033
1.22%
jan 1, 1969
1.722
-0.987
-36.43%
jan 1, 1970
1.531
-0.191
-11.08%
jan 1, 1971
1.306
-0.225
-14.71%
jan 1, 1972
1.471
+0.165
12.63%
jan 1, 1973
0.849
-0.622
-42.3%
jan 1, 1974
0.899
+0.05
5.94%
jan 1, 1975
1.219
+0.32
35.61%
jan 1, 1976
1.607
+0.387
31.77%
jan 1, 1977
1.673
+0.067
4.15%
jan 1, 1978
0.802
-0.872
-52.09%
jan 1, 1979
0.811
+0.009
1.13%
jan 1, 1980
0.875
+0.064
7.87%
jan 1, 1981
1.15
+0.276
31.53%
jan 1, 1982
1.002
-0.149
-12.93%
jan 1, 1983
0.804
-0.198
-19.78%
jan 1, 1984
0.828
+0.024
3.0%
jan 1, 1985
0.776
-0.052
-6.24%
jan 1, 1986
0.674
-0.102
-13.13%
jan 1, 1987
0.79
+0.116
17.17%
jan 1, 1988
0.601
-0.188
-23.85%
jan 1, 1989
0.652
+0.051
8.46%
jan 1, 1990
0.594
-0.058
-8.91%
jan 1, 1991
0.434
-0.16
-26.97%
jan 1, 1992
1.011
+0.577
132.93%
jan 1, 1993
0.839
-0.172
-17.01%
jan 1, 1994
0.522
-0.317
-37.82%
jan 1, 1995
0.705
+0.183
35.11%
jan 1, 1996
0.477
-0.228
-32.31%
jan 1, 1997
0.478
+0.001
0.17%
jan 1, 1998
0.391
-0.087
-18.13%
jan 1, 1999
0.377
-0.014
-3.54%
jan 1, 2000
0.32
-0.057
-15.13%
jan 1, 2001
0.291
-0.029
-9.1%
jan 1, 2002
0.354
+0.063
21.5%
jan 1, 2003
0.338
-0.016
-4.51%
jan 1, 2004
0.119
-0.219
-64.8%
jan 1, 2005
0.108
-0.011
-9.15%
jan 1, 2006
0.226
+0.118
109.66%
jan 1, 2007
0.147
-0.079
-35.09%
jan 1, 2008
0.116
-0.031
-20.9%
jan 1, 2009
0.179
+0.063
54.35%
jan 1, 2010
0.19
+0.011
5.89%
jan 1, 2011
0.172
-0.018
-9.69%
jan 1, 2012
0.18
+0.008
4.66%
jan 1, 2013
0.092
-0.087
-48.64%
jan 1, 2014
0.132
+0.04
43.48%
jan 1, 2015
0.148
+0.015
11.69%
Ranking of countries by current statistics by years


Comments: