29
/
en
AIzaSyAYiBZKx7MnpbEhh9jyipgxe19OcubqV5w
April 1, 2024
105242
Chile
CHL
true
2
1
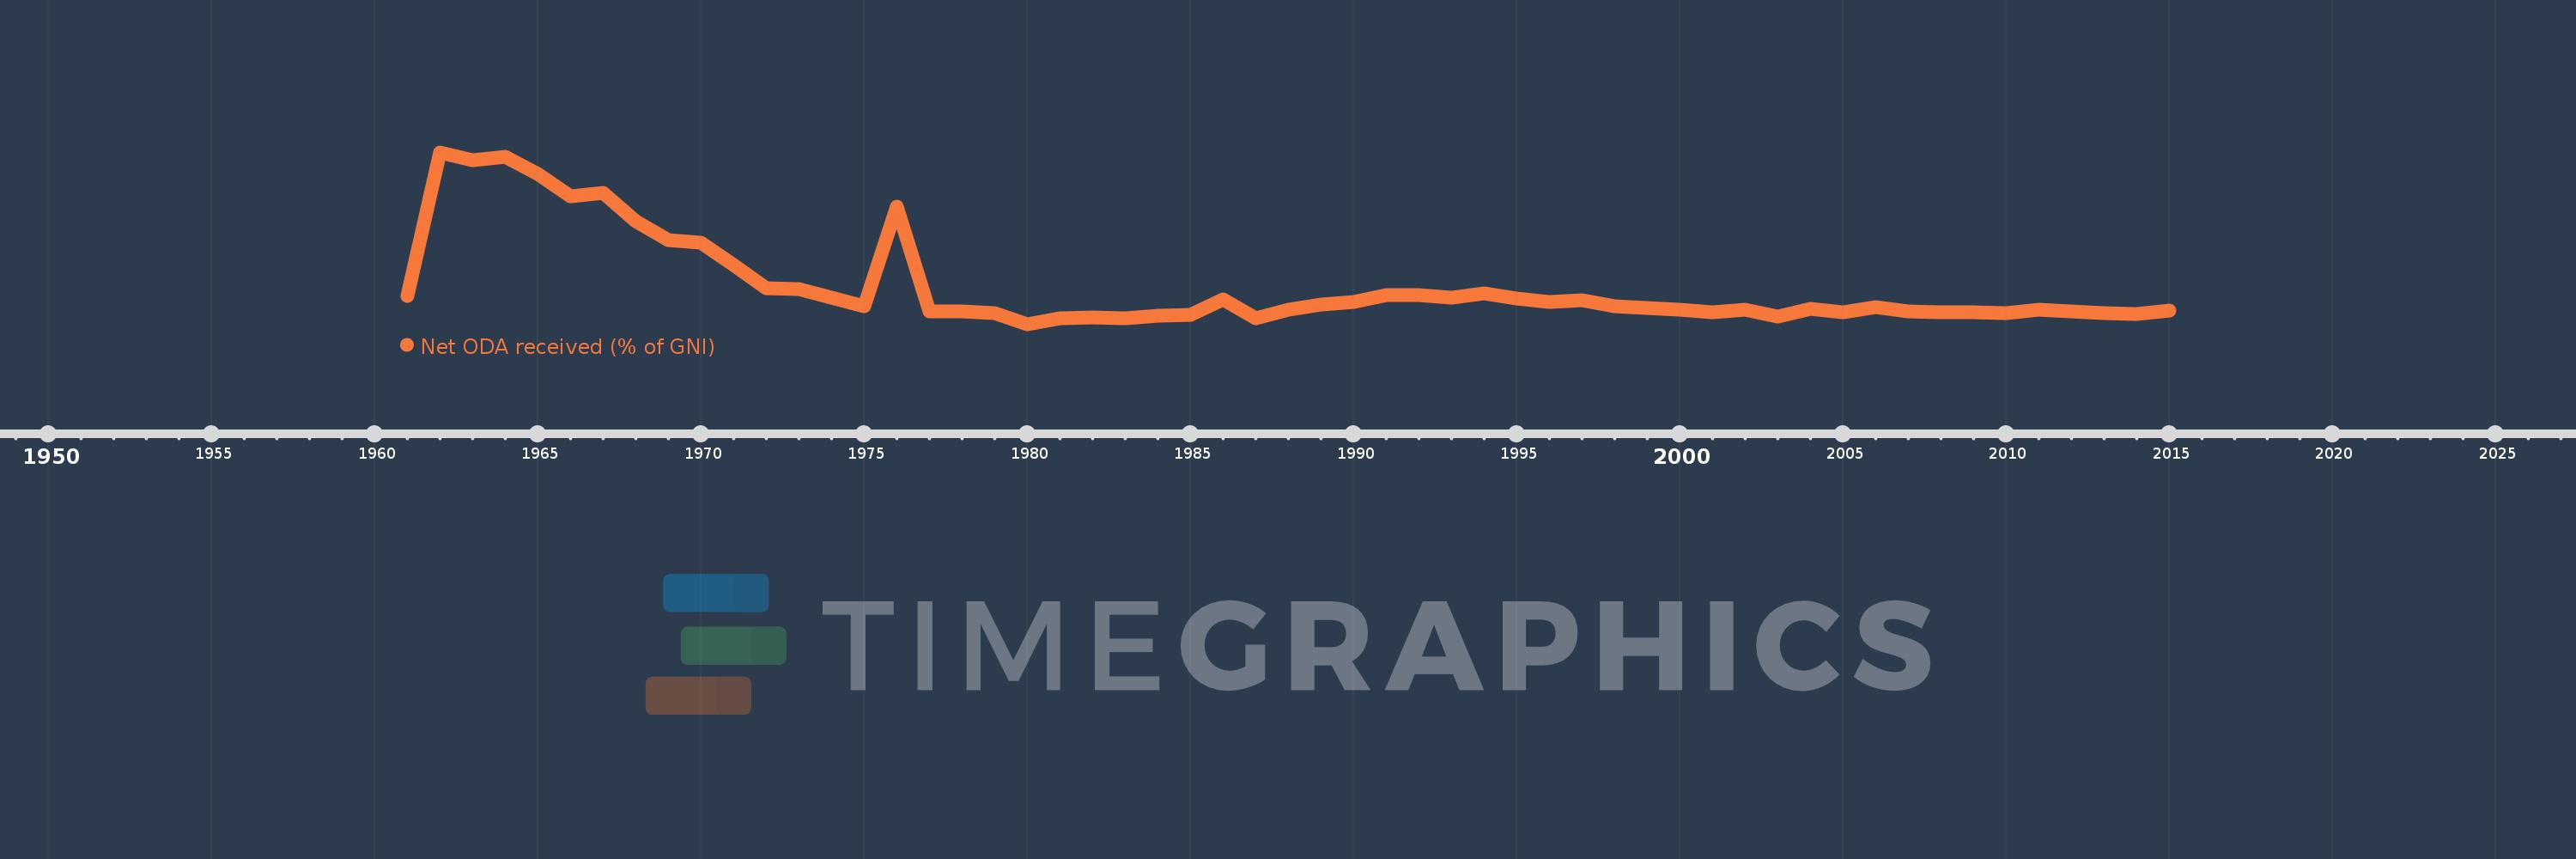
Net ODA received (% of GNI)
2015,2014,2013,2012,2011,2010,2009,2008,2007,2006,2005,2004,2003,2002,2001,2000,1999,1998,1997,1996,1995,1994,1993,1992,1991,1990,1989,1988,1987,1986,1985,1984,1983,1982,1981,1980,1979,1978,1977,1976,1975,1974,1973,1972,1971,1970,1969,1968,1967,1966,1965,1964,1963,1962,1961
This statistics in other country:
AfghanistanAlbaniaAlgeriaAngolaAntigua and BarbudaArab WorldArgentinaArmeniaAzerbaijanBahamas, TheBahrainBangladeshBarbadosBelarusBelizeBeninBermudaBhutanBoliviaBosnia and HerzegovinaBotswanaBrazilBrunei DarussalamBurkina FasoBurundiCabo VerdeCambodiaCameroonCaribbean small statesCentral African RepublicCentral Europe and the BalticsChadChileChinaColombiaComorosCongo, Dem. Rep.Congo, Rep.Costa RicaCote d'IvoireCroatiaCubaCyprusDjiboutiDominicaDominican RepublicEast Asia & PacificEast Asia & Pacific (excluding high income)East Asia & Pacific (IDA & IBRD countries)EcuadorEgypt, Arab Rep.El SalvadorEquatorial GuineaEritreaEthiopiaEuro areaEurope & Central AsiaEurope & Central Asia (excluding high income)Europe & Central Asia (IDA & IBRD countries)European UnionFijiFragile and conflict affected situationsFrench PolynesiaGabonGambia, TheGeorgiaGhanaGrenadaGuatemalaGuineaGuinea-BissauGuyanaHaitiHeavily indebted poor countries (HIPC)High incomeHondurasHong Kong SAR, ChinaIBRD onlyIDA & IBRD totalIDA blendIDA onlyIDA totalIndiaIndonesiaIran, Islamic Rep.IraqIsraelJamaicaJordanKazakhstanKenyaKiribatiKorea, Rep.KosovoKuwaitKyrgyz RepublicLao PDRLatin America & Caribbean Latin America & Caribbean (excluding high income)Latin America & the Caribbean (IDA & IBRD countries)Least developed countries: UN classificationLebanonLesothoLiberiaLibyaLow & middle incomeLow incomeLower middle incomeMacao SAR, ChinaMacedonia, FYRMadagascarMalawiMalaysiaMaldivesMaliMaltaMarshall IslandsMauritaniaMauritiusMexicoMicronesia, Fed. Sts.Middle East & North AfricaMiddle East & North Africa (excluding high income)Middle East & North Africa (IDA & IBRD countries)Middle incomeMoldovaMongoliaMontenegroMoroccoMozambiqueMyanmarNamibiaNauruNepalNew CaledoniaNicaraguaNigerNigeriaNorth AmericaOECD membersOmanOther small statesPacific island small statesPakistanPalauPanamaPapua New GuineaParaguayPeruPhilippinesQatarRwandaSamoaSao Tome and PrincipeSaudi ArabiaSenegalSerbiaSeychellesSierra LeoneSingaporeSloveniaSmall statesSolomon IslandsSomaliaSouth AfricaSouth AsiaSouth Asia (IDA & IBRD)South SudanSri LankaSt. Kitts and NevisSt. LuciaSt. Vincent and the GrenadinesSub-Saharan Africa Sub-Saharan Africa (excluding high income)Sub-Saharan Africa (IDA & IBRD countries)SudanSurinameSwazilandSyrian Arab RepublicTajikistanTanzaniaThailandTimor-LesteTogoTongaTrinidad and TobagoTunisiaTurkeyTurkmenistanTuvaluUgandaUkraineUpper middle incomeUruguayUzbekistanVanuatuVenezuela, RBVietnamWest Bank and GazaWorldYemen, Rep.ZambiaZimbabwe Timeline:
This timeline shows a graph from 1961 to 2015 of Chile. No data until 1960. Number of actual observations by date: 55.
Source name:
World Development Indicators
Source organization:
Development Assistance Committee of the Organisation for Economic Co-operation and Development, Geographical Distribution of Financial Flows to Developing Countries, Development Co-operation Report, and International Development Statistics database. Data are available online at: www.oecd.org/dac/stats/idsonline. World Bank GNI estimates are used for the denominator.
Categories, topics:
Aid Effectiveness, Economy & Growth, External Debt
Last updated:
apr 23, 2017
Indicators value changes by year
Minimum:
-0.139
jan 1, 1980
At the date of observation
Value
Absolute change
Change from previous value
jan 1, 1961
0.341
+0.341
0.0%
jan 1, 1962
2.739
+2.399
703.89%
jan 1, 1963
2.611
-0.129
-4.7%
jan 1, 1964
2.671
+0.06
2.32%
jan 1, 1965
2.371
-0.3
-11.22%
jan 1, 1966
2.006
-0.365
-15.4%
jan 1, 1967
2.058
+0.052
2.57%
jan 1, 1968
1.581
-0.477
-23.17%
jan 1, 1969
1.276
-0.305
-19.31%
jan 1, 1970
1.231
-0.045
-3.54%
jan 1, 1971
0.852
-0.379
-30.78%
jan 1, 1972
0.466
-0.386
-45.33%
jan 1, 1973
0.446
-0.019
-4.14%
jan 1, 1974
0.308
-0.139
-31.11%
jan 1, 1975
0.155
-0.153
-49.76%
jan 1, 1976
1.83
+1.675
1.08K%
jan 1, 1977
0.077
-1.753
-95.81%
jan 1, 1978
0.077
+0.001
0.73%
jan 1, 1979
0.048
-0.029
-37.67%
jan 1, 1980
-0.139
-0.187
-389.59%
jan 1, 1981
-0.04
+0.099
-71.45%
jan 1, 1982
-0.023
+0.016
-41.25%
jan 1, 1983
-0.04
-0.016
69.74%
jan 1, 1984
0.001
+0.04
-101.4%
jan 1, 1985
0.013
+0.013
2.26K%
jan 1, 1986
0.278
+0.265
2.02K%
jan 1, 1987
-0.033
-0.31
-111.74%
jan 1, 1988
0.111
+0.144
-441.07%
jan 1, 1989
0.196
+0.084
75.78%
jan 1, 1990
0.234
+0.038
19.49%
jan 1, 1991
0.347
+0.114
48.66%
jan 1, 1992
0.351
+0.003
0.93%
jan 1, 1993
0.309
-0.042
-12.01%
jan 1, 1994
0.378
+0.069
22.36%
jan 1, 1995
0.285
-0.092
-24.43%
jan 1, 1996
0.228
-0.057
-20.06%
jan 1, 1997
0.267
+0.039
16.91%
jan 1, 1998
0.161
-0.106
-39.7%
jan 1, 1999
0.137
-0.024
-14.66%
jan 1, 2000
0.099
-0.038
-28.02%
jan 1, 2001
0.064
-0.035
-35.27%
jan 1, 2002
0.108
+0.044
68.58%
jan 1, 2003
-0.011
-0.119
-110.0%
jan 1, 2004
0.117
+0.128
-1.18K%
jan 1, 2005
0.059
-0.058
-49.83%
jan 1, 2006
0.147
+0.088
150.65%
jan 1, 2007
0.074
-0.072
-49.33%
jan 1, 2008
0.068
-0.006
-8.7%
jan 1, 2009
0.065
-0.003
-4.78%
jan 1, 2010
0.049
-0.016
-24.34%
jan 1, 2011
0.097
+0.048
98.74%
jan 1, 2012
0.069
-0.028
-28.71%
jan 1, 2013
0.049
-0.02
-29.1%
jan 1, 2014
0.03
-0.019
-39.63%
jan 1, 2015
0.096
+0.066
222.81%
Ranking of countries by current statistics by years


Comments: