29
/
en
AIzaSyAYiBZKx7MnpbEhh9jyipgxe19OcubqV5w
April 1, 2024
83049
Belize
BLZ
true
2
1
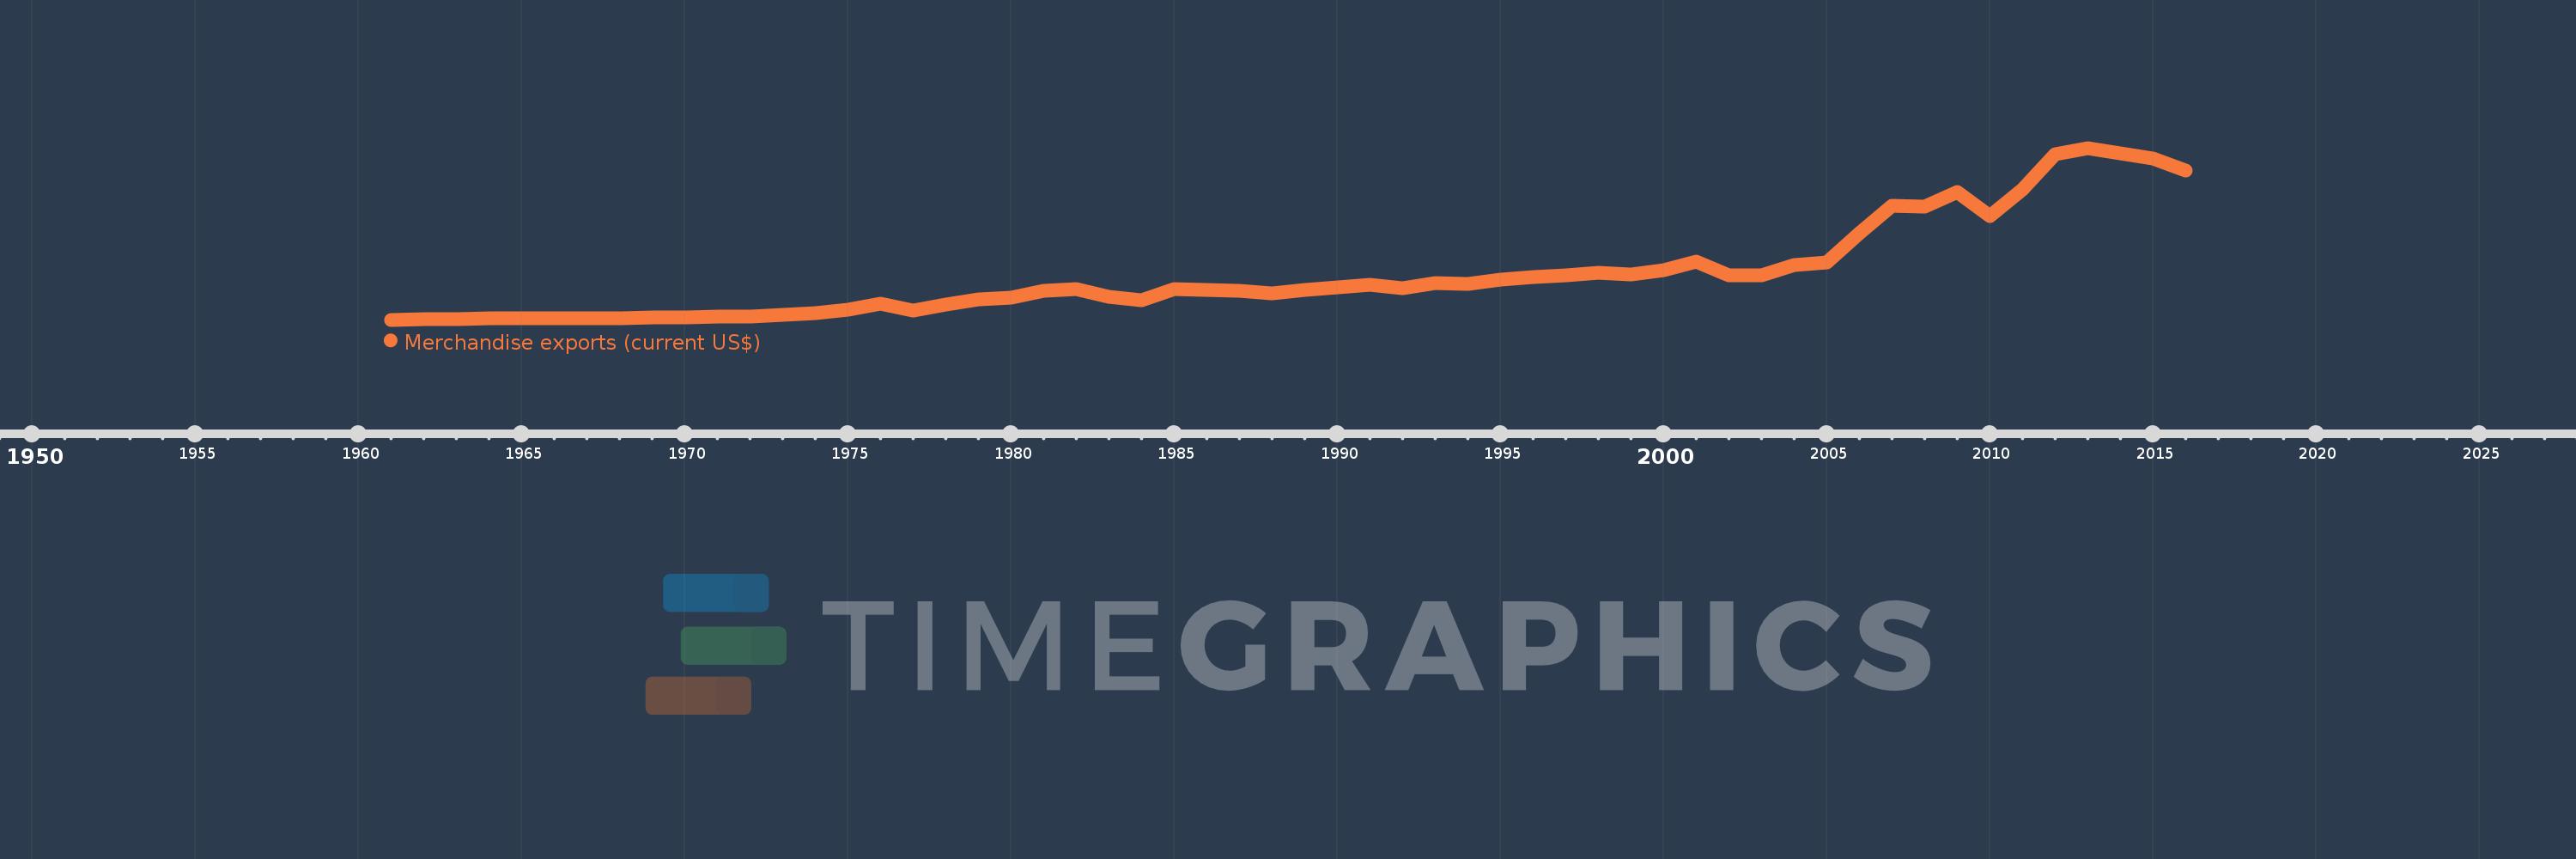
Merchandise exports (current US$)
2016,2015,2014,2013,2012,2011,2010,2009,2008,2007,2006,2005,2004,2003,2002,2001,2000,1999,1998,1997,1996,1995,1994,1993,1992,1991,1990,1989,1988,1987,1986,1985,1984,1983,1982,1981,1980,1979,1978,1977,1976,1975,1974,1973,1972,1971,1970,1969,1968,1967,1966,1965,1964,1963,1962,1961
This statistics in other country:
AfghanistanAlbaniaAlgeriaAmerican SamoaAngolaAntigua and BarbudaArab WorldArgentinaArmeniaArubaAustraliaAustriaAzerbaijanBahamas, TheBahrainBangladeshBarbadosBelarusBelgiumBelizeBeninBermudaBhutanBoliviaBosnia and HerzegovinaBotswanaBrazilBrunei DarussalamBulgariaBurkina FasoBurundiCabo VerdeCambodiaCameroonCanadaCaribbean small statesCentral African RepublicCentral Europe and the BalticsChadChileChinaColombiaComorosCongo, Dem. Rep.Congo, Rep.Costa RicaCote d'IvoireCroatiaCubaCuracaoCyprusCzech RepublicDenmarkDjiboutiDominicaDominican RepublicEarly-demographic dividendEast Asia & PacificEast Asia & Pacific (excluding high income)East Asia & Pacific (IDA & IBRD countries)EcuadorEgypt, Arab Rep.El SalvadorEquatorial GuineaEritreaEstoniaEthiopiaEuro areaEurope & Central AsiaEurope & Central Asia (excluding high income)Europe & Central Asia (IDA & IBRD countries)European UnionFaroe IslandsFijiFinlandFragile and conflict affected situationsFranceFrench PolynesiaGabonGambia, TheGeorgiaGermanyGhanaGreeceGreenlandGrenadaGuamGuatemalaGuineaGuinea-BissauGuyanaHaitiHeavily indebted poor countries (HIPC)High incomeHondurasHong Kong SAR, ChinaHungaryIBRD onlyIcelandIDA & IBRD totalIDA blendIDA onlyIDA totalIndiaIndonesiaIran, Islamic Rep.IraqIrelandIsraelItalyJamaicaJapanJordanKazakhstanKenyaKiribatiKorea, Dem. People’s Rep.Korea, Rep.KuwaitKyrgyz RepublicLao PDRLate-demographic dividendLatin America & Caribbean Latin America & Caribbean (excluding high income)Latin America & the Caribbean (IDA & IBRD countries)LatviaLeast developed countries: UN classificationLebanonLesothoLiberiaLibyaLithuaniaLow & middle incomeLow incomeLower middle incomeLuxembourgMacao SAR, ChinaMacedonia, FYRMadagascarMalawiMalaysiaMaldivesMaliMaltaMarshall IslandsMauritaniaMauritiusMexicoMicronesia, Fed. Sts.Middle East & North AfricaMiddle East & North Africa (excluding high income)Middle East & North Africa (IDA & IBRD countries)Middle incomeMoldovaMongoliaMontenegroMoroccoMozambiqueMyanmarNamibiaNepalNetherlandsNew CaledoniaNew ZealandNicaraguaNigerNigeriaNorth AmericaNorthern Mariana IslandsNorwayOECD membersOmanOther small statesPacific island small statesPakistanPalauPanamaPapua New GuineaParaguayPeruPhilippinesPolandPortugalPost-demographic dividendPre-demographic dividendQatarRomaniaRussian FederationRwandaSamoaSao Tome and PrincipeSaudi ArabiaSenegalSerbiaSeychellesSierra LeoneSingaporeSint Maarten (Dutch part)Slovak RepublicSloveniaSmall statesSolomon IslandsSouth AfricaSouth AsiaSouth Asia (IDA & IBRD)SpainSri LankaSt. Kitts and NevisSt. LuciaSt. Martin (French part)St. Vincent and the GrenadinesSub-Saharan Africa Sub-Saharan Africa (excluding high income)Sub-Saharan Africa (IDA & IBRD countries)SudanSurinameSwazilandSwedenSwitzerlandSyrian Arab RepublicTajikistanTanzaniaThailandTimor-LesteTogoTongaTrinidad and TobagoTunisiaTurkeyTurkmenistanTuvaluUgandaUkraineUnited Arab EmiratesUnited KingdomUnited StatesUpper middle incomeUruguayUzbekistanVanuatuVenezuela, RBVietnamWorldYemen, Rep.ZambiaZimbabwe Timeline:
This timeline shows a graph from 1961 to 2016 of Belize. No data until 1960. Number of actual observations by date: 56.
Source name:
World Development Indicators
Source organization:
World Trade Organization.
Categories, topics:
Private Sector, Trade
Last updated:
apr 23, 2017
Indicators value changes by year
Minimum:
7.872 mln
jan 1, 1961
Maximum:
627.25 mln
jan 1, 2013
At the date of observation
Value
Absolute change
Change from previous value
jan 1, 1961
7.872 mln
+7.872 mln
0.0%
jan 1, 1962
8.681 mln
+809.9K
10.29%
jan 1, 1963
8.667 mln
-14.7K
-0.17%
jan 1, 1964
13.0 mln
+4.334 mln
50.0%
jan 1, 1965
13.435 mln
+434.7K
3.34%
jan 1, 1966
12.224 mln
-1.211 mln
-9.01%
jan 1, 1967
13.467 mln
+1.243 mln
10.17%
jan 1, 1968
14.133 mln
+665.4K
4.94%
jan 1, 1969
15.116 mln
+983.7K
6.96%
jan 1, 1970
16.848 mln
+1.732 mln
11.46%
jan 1, 1971
18.8 mln
+1.952 mln
11.59%
jan 1, 1972
19.278 mln
+477.7K
2.54%
jan 1, 1973
25.529 mln
+6.251 mln
32.43%
jan 1, 1974
32.27 mln
+6.74 mln
26.4%
jan 1, 1975
44.924 mln
+12.655 mln
39.22%
jan 1, 1976
66.59 mln
+21.666 mln
48.23%
jan 1, 1977
42.253 mln
-24.337 mln
-36.55%
jan 1, 1978
62.082 mln
+19.829 mln
46.93%
jan 1, 1979
79.782 mln
+17.701 mln
28.51%
jan 1, 1980
86.731 mln
+6.949 mln
8.71%
jan 1, 1981
111.0 mln
+24.269 mln
27.98%
jan 1, 1982
119.0 mln
+8.0 mln
7.21%
jan 1, 1983
91.0 mln
-28.0 mln
-23.53%
jan 1, 1984
78.0 mln
-13.0 mln
-14.29%
jan 1, 1985
117.0 mln
+39.0 mln
50.0%
jan 1, 1986
115.0 mln
-2.0 mln
-1.71%
jan 1, 1987
111.0 mln
-4.0 mln
-3.48%
jan 1, 1988
103.0 mln
-8.0 mln
-7.21%
jan 1, 1989
116.0 mln
+13.0 mln
12.62%
jan 1, 1990
125.0 mln
+9.0 mln
7.76%
jan 1, 1991
133.0 mln
+8.0 mln
6.4%
jan 1, 1992
122.0 mln
-11.0 mln
-8.27%
jan 1, 1993
141.0 mln
+19.0 mln
15.57%
jan 1, 1994
136.0 mln
-5.0 mln
-3.55%
jan 1, 1995
151.0 mln
+15.0 mln
11.03%
jan 1, 1996
162.0 mln
+11.0 mln
7.28%
jan 1, 1997
168.0 mln
+6.0 mln
3.7%
jan 1, 1998
176.0 mln
+8.0 mln
4.76%
jan 1, 1999
172.0 mln
-4.0 mln
-2.27%
jan 1, 2000
186.0 mln
+14.0 mln
8.14%
jan 1, 2001
218.0 mln
+32.0 mln
17.2%
jan 1, 2002
169.0 mln
-49.0 mln
-22.48%
jan 1, 2003
169.0 mln
0.0
0.0%
jan 1, 2004
205.0 mln
+36.0 mln
21.3%
jan 1, 2005
213.0 mln
+8.0 mln
3.9%
jan 1, 2006
319.111 mln
+106.111 mln
49.82%
jan 1, 2007
419.339 mln
+100.228 mln
31.41%
jan 1, 2008
416.351 mln
-2.988 mln
-0.71%
jan 1, 2009
469.145 mln
+52.794 mln
12.68%
jan 1, 2010
380.98 mln
-88.166 mln
-18.79%
jan 1, 2011
478.209 mln
+97.23 mln
25.52%
jan 1, 2012
603.7 mln
+125.491 mln
26.24%
jan 1, 2013
627.25 mln
+23.55 mln
3.9%
jan 1, 2014
608.798 mln
-18.452 mln
-2.94%
jan 1, 2015
588.687 mln
-20.111 mln
-3.3%
jan 1, 2016
545.0 mln
-43.687 mln
-7.42%
Ranking of countries by current statistics by years


Comments: