29
/
en
AIzaSyAYiBZKx7MnpbEhh9jyipgxe19OcubqV5w
April 1, 2024
227633
Qatar
QAT
true
2
1
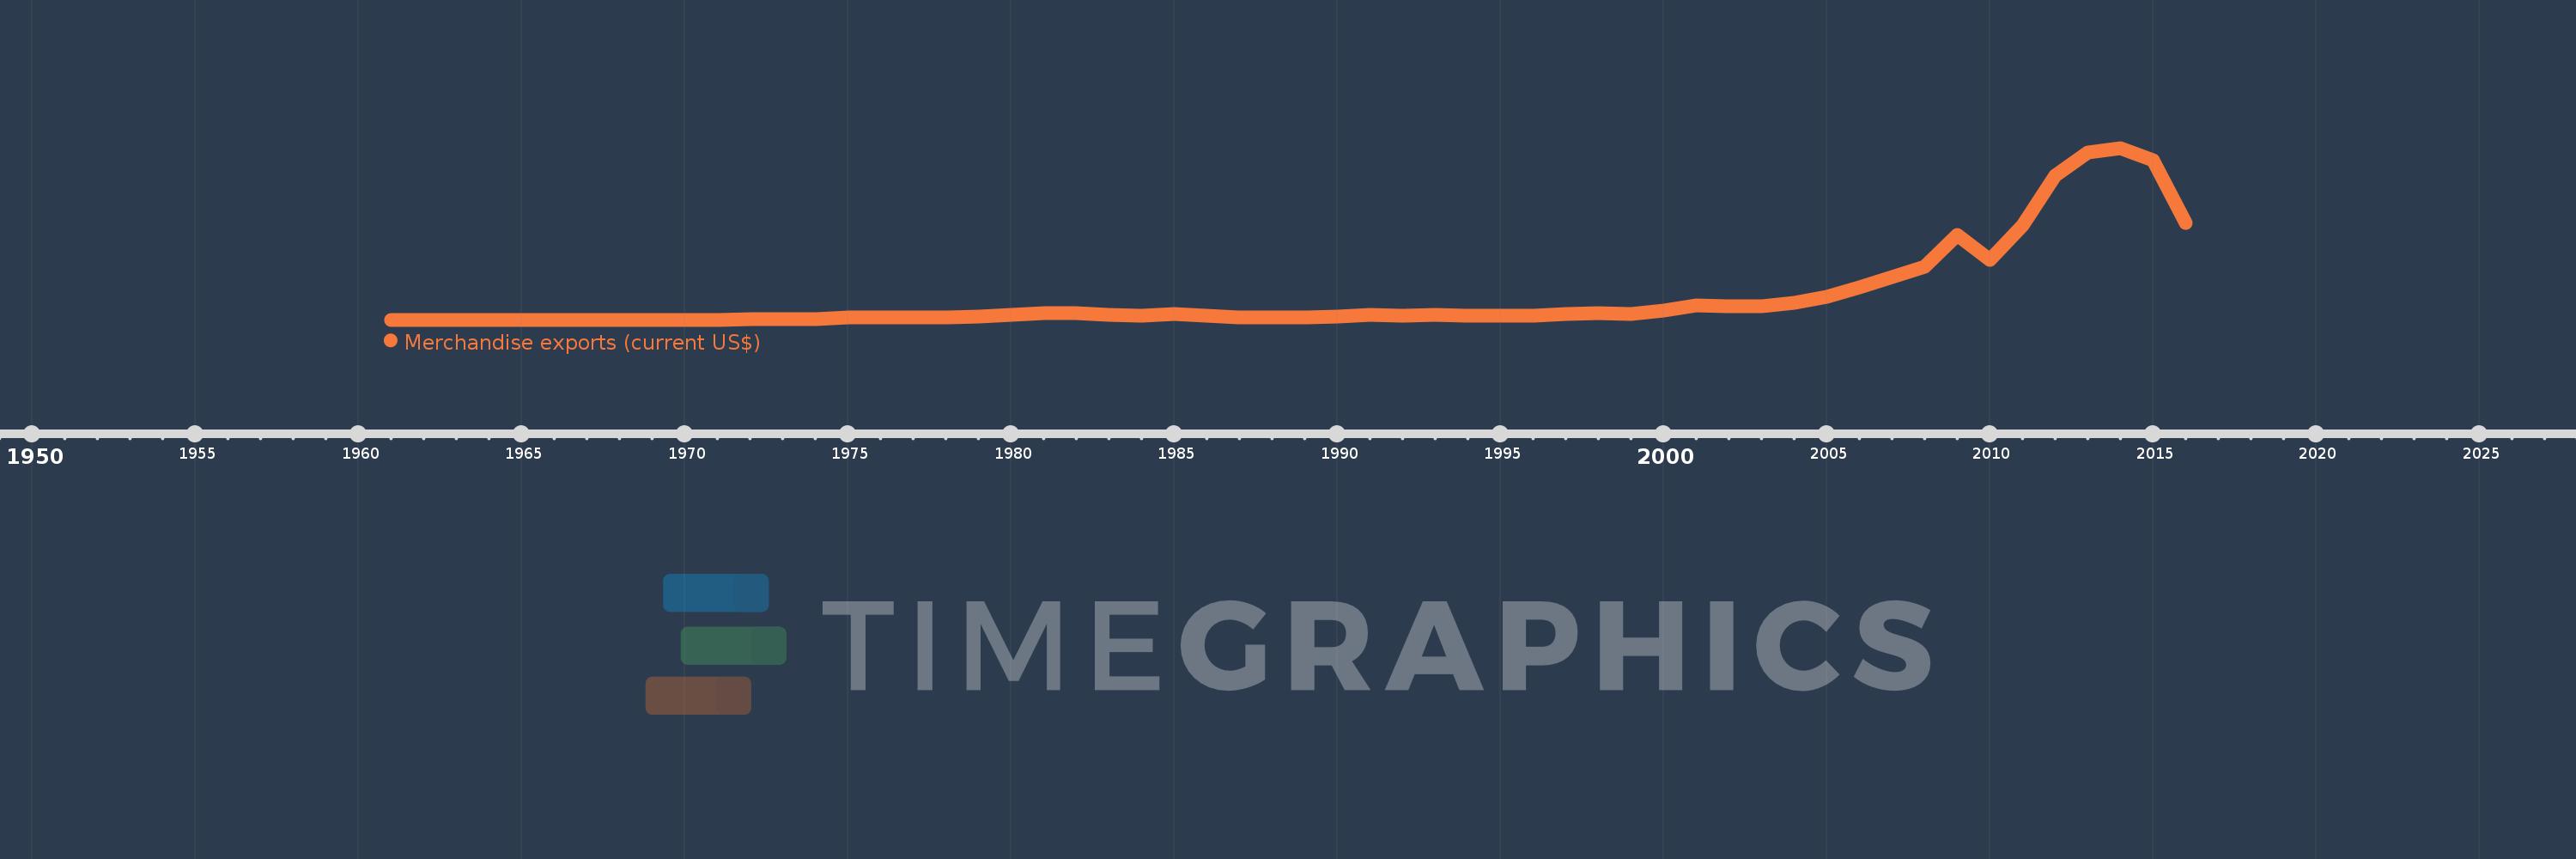
Merchandise exports (current US$)
2016,2015,2014,2013,2012,2011,2010,2009,2008,2007,2006,2005,2004,2003,2002,2001,2000,1999,1998,1997,1996,1995,1994,1993,1992,1991,1990,1989,1988,1987,1986,1985,1984,1983,1982,1981,1980,1979,1978,1977,1976,1975,1974,1973,1972,1971,1970,1969,1968,1967,1966,1965,1964,1963,1962,1961
This statistics in other country:
AfghanistanAlbaniaAlgeriaAmerican SamoaAngolaAntigua and BarbudaArab WorldArgentinaArmeniaArubaAustraliaAustriaAzerbaijanBahamas, TheBahrainBangladeshBarbadosBelarusBelgiumBelizeBeninBermudaBhutanBoliviaBosnia and HerzegovinaBotswanaBrazilBrunei DarussalamBulgariaBurkina FasoBurundiCabo VerdeCambodiaCameroonCanadaCaribbean small statesCentral African RepublicCentral Europe and the BalticsChadChileChinaColombiaComorosCongo, Dem. Rep.Congo, Rep.Costa RicaCote d'IvoireCroatiaCubaCuracaoCyprusCzech RepublicDenmarkDjiboutiDominicaDominican RepublicEarly-demographic dividendEast Asia & PacificEast Asia & Pacific (excluding high income)East Asia & Pacific (IDA & IBRD countries)EcuadorEgypt, Arab Rep.El SalvadorEquatorial GuineaEritreaEstoniaEthiopiaEuro areaEurope & Central AsiaEurope & Central Asia (excluding high income)Europe & Central Asia (IDA & IBRD countries)European UnionFaroe IslandsFijiFinlandFragile and conflict affected situationsFranceFrench PolynesiaGabonGambia, TheGeorgiaGermanyGhanaGreeceGreenlandGrenadaGuamGuatemalaGuineaGuinea-BissauGuyanaHaitiHeavily indebted poor countries (HIPC)High incomeHondurasHong Kong SAR, ChinaHungaryIBRD onlyIcelandIDA & IBRD totalIDA blendIDA onlyIDA totalIndiaIndonesiaIran, Islamic Rep.IraqIrelandIsraelItalyJamaicaJapanJordanKazakhstanKenyaKiribatiKorea, Dem. People’s Rep.Korea, Rep.KuwaitKyrgyz RepublicLao PDRLate-demographic dividendLatin America & Caribbean Latin America & Caribbean (excluding high income)Latin America & the Caribbean (IDA & IBRD countries)LatviaLeast developed countries: UN classificationLebanonLesothoLiberiaLibyaLithuaniaLow & middle incomeLow incomeLower middle incomeLuxembourgMacao SAR, ChinaMacedonia, FYRMadagascarMalawiMalaysiaMaldivesMaliMaltaMarshall IslandsMauritaniaMauritiusMexicoMicronesia, Fed. Sts.Middle East & North AfricaMiddle East & North Africa (excluding high income)Middle East & North Africa (IDA & IBRD countries)Middle incomeMoldovaMongoliaMontenegroMoroccoMozambiqueMyanmarNamibiaNepalNetherlandsNew CaledoniaNew ZealandNicaraguaNigerNigeriaNorth AmericaNorthern Mariana IslandsNorwayOECD membersOmanOther small statesPacific island small statesPakistanPalauPanamaPapua New GuineaParaguayPeruPhilippinesPolandPortugalPost-demographic dividendPre-demographic dividendQatarRomaniaRussian FederationRwandaSamoaSao Tome and PrincipeSaudi ArabiaSenegalSerbiaSeychellesSierra LeoneSingaporeSint Maarten (Dutch part)Slovak RepublicSloveniaSmall statesSolomon IslandsSouth AfricaSouth AsiaSouth Asia (IDA & IBRD)SpainSri LankaSt. Kitts and NevisSt. LuciaSt. Martin (French part)St. Vincent and the GrenadinesSub-Saharan Africa Sub-Saharan Africa (excluding high income)Sub-Saharan Africa (IDA & IBRD countries)SudanSurinameSwazilandSwedenSwitzerlandSyrian Arab RepublicTajikistanTanzaniaThailandTimor-LesteTogoTongaTrinidad and TobagoTunisiaTurkeyTurkmenistanTuvaluUgandaUkraineUnited Arab EmiratesUnited KingdomUnited StatesUpper middle incomeUruguayUzbekistanVanuatuVenezuela, RBVietnamWorldYemen, Rep.ZambiaZimbabwe Timeline:
This timeline shows a graph from 1961 to 2016 of Qatar. No data until 1960. Number of actual observations by date: 56.
Source name:
World Development Indicators
Source organization:
World Trade Organization.
Categories, topics:
Private Sector, Trade
Last updated:
apr 23, 2017
Indicators value changes by year
Minimum:
122.0 mln
jan 1, 1962
Maximum:
136.767 bln
jan 1, 2014
At the date of observation
Value
Absolute change
Change from previous value
jan 1, 1961
126.0 mln
+126.0 mln
0.0%
jan 1, 1962
122.0 mln
-4.0 mln
-3.17%
jan 1, 1963
131.0 mln
+9.0 mln
7.38%
jan 1, 1964
136.0 mln
+5.0 mln
3.82%
jan 1, 1965
151.0 mln
+15.0 mln
11.03%
jan 1, 1966
163.0 mln
+12.0 mln
7.95%
jan 1, 1967
180.416 mln
+17.416 mln
10.68%
jan 1, 1968
201.71 mln
+21.294 mln
11.8%
jan 1, 1969
210.919 mln
+9.209 mln
4.57%
jan 1, 1970
222.662 mln
+11.743 mln
5.57%
jan 1, 1971
239.903 mln
+17.241 mln
7.74%
jan 1, 1972
315.185 mln
+75.282 mln
31.38%
jan 1, 1973
396.655 mln
+81.47 mln
25.85%
jan 1, 1974
628.412 mln
+231.757 mln
58.43%
jan 1, 1975
2.015 bln
+1.386 bln
220.63%
jan 1, 1976
1.805 bln
-210.0 mln
-10.42%
jan 1, 1977
2.21 bln
+404.67 mln
22.42%
jan 1, 1978
2.072 bln
-137.18 mln
-6.21%
jan 1, 1979
2.391 bln
+318.31 mln
15.36%
jan 1, 1980
3.753 bln
+1.362 bln
56.98%
jan 1, 1981
5.672 bln
+1.919 bln
51.14%
jan 1, 1982
5.691 bln
+19.0 mln
0.33%
jan 1, 1983
4.343 bln
-1.348 bln
-23.69%
jan 1, 1984
3.345 bln
-998.0 mln
-22.98%
jan 1, 1985
4.513 bln
+1.168 bln
34.92%
jan 1, 1986
3.419 bln
-1.094 bln
-24.24%
jan 1, 1987
1.849 bln
-1.57 bln
-45.92%
jan 1, 1988
1.985 bln
+136.0 mln
7.36%
jan 1, 1989
2.21 bln
+225.0 mln
11.34%
jan 1, 1990
2.686 bln
+476.0 mln
21.54%
jan 1, 1991
3.89 bln
+1.204 bln
44.83%
jan 1, 1992
3.21 bln
-680.0 mln
-17.48%
jan 1, 1993
3.841 bln
+631.0 mln
19.66%
jan 1, 1994
3.245 bln
-596.0 mln
-15.52%
jan 1, 1995
3.213 bln
-32.0 mln
-0.99%
jan 1, 1996
3.651 bln
+438.0 mln
13.63%
jan 1, 1997
4.447 bln
+796.0 mln
21.8%
jan 1, 1998
5.57 bln
+1.123 bln
25.25%
jan 1, 1999
5.03 bln
-540.0 mln
-9.69%
jan 1, 2000
7.214 bln
+2.184 bln
43.42%
jan 1, 2001
11.594 bln
+4.38 bln
60.72%
jan 1, 2002
10.871 bln
-723.0 mln
-6.24%
jan 1, 2003
10.978 bln
+107.0 mln
0.98%
jan 1, 2004
13.382 bln
+2.404 bln
21.9%
jan 1, 2005
18.684 bln
+5.302 bln
39.62%
jan 1, 2006
25.762 bln
+7.078 bln
37.88%
jan 1, 2007
34.051 bln
+8.289 bln
32.18%
jan 1, 2008
42.02 bln
+7.969 bln
23.4%
jan 1, 2009
67.307 bln
+25.288 bln
60.18%
jan 1, 2010
48.007 bln
-19.3 bln
-28.67%
jan 1, 2011
74.964 bln
+26.957 bln
56.15%
jan 1, 2012
114.448 bln
+39.484 bln
52.67%
jan 1, 2013
132.962 bln
+18.513 bln
16.18%
jan 1, 2014
136.767 bln
+3.806 bln
2.86%
jan 1, 2015
126.703 bln
-10.065 bln
-7.36%
jan 1, 2016
77.294 bln
-49.409 bln
-39.0%
Ranking of countries by current statistics by years


Comments: