29
/
en
AIzaSyAYiBZKx7MnpbEhh9jyipgxe19OcubqV5w
April 1, 2024
47338
Lower middle income
LMC
false
2
1
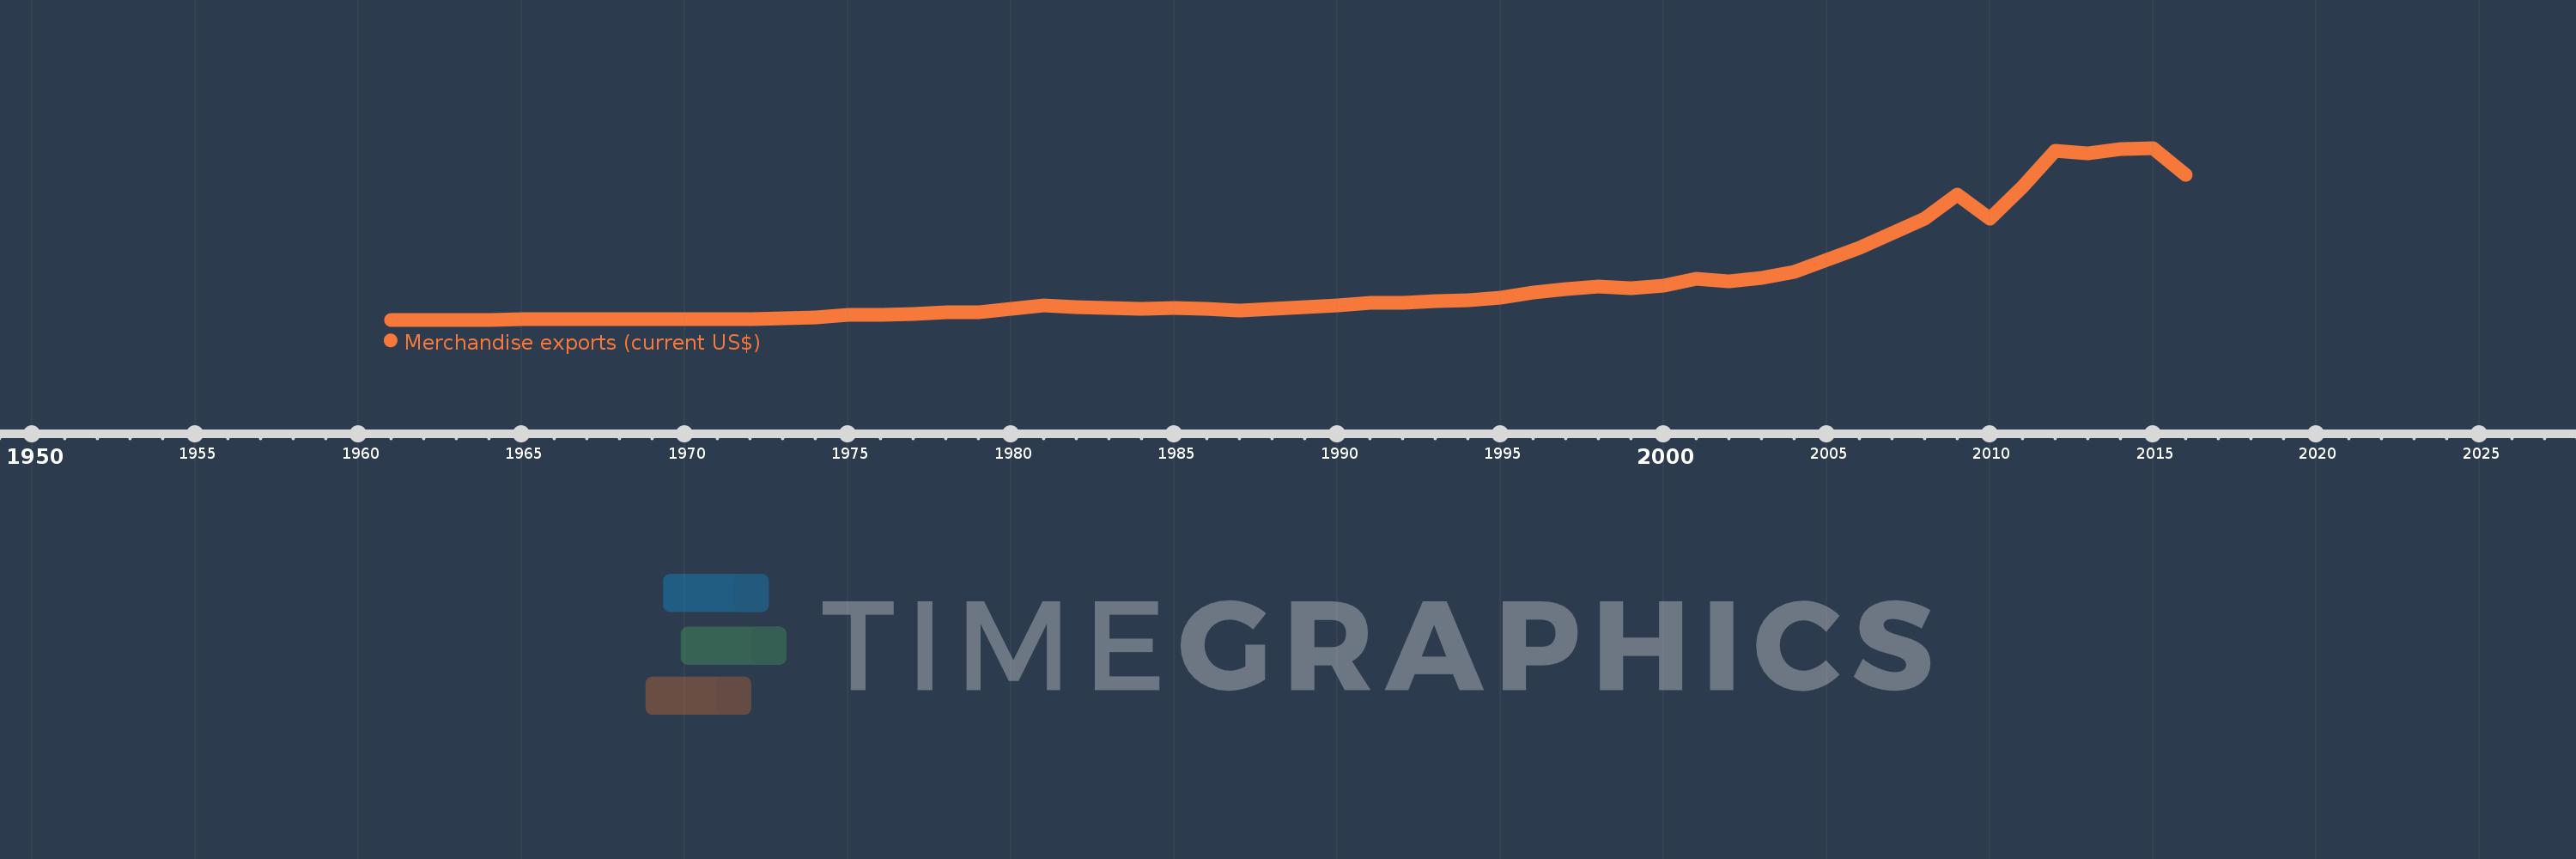
Merchandise exports (current US$)
2016,2015,2014,2013,2012,2011,2010,2009,2008,2007,2006,2005,2004,2003,2002,2001,2000,1999,1998,1997,1996,1995,1994,1993,1992,1991,1990,1989,1988,1987,1986,1985,1984,1983,1982,1981,1980,1979,1978,1977,1976,1975,1974,1973,1972,1971,1970,1969,1968,1967,1966,1965,1964,1963,1962,1961
This statistics in other country:
AfghanistanAlbaniaAlgeriaAmerican SamoaAngolaAntigua and BarbudaArab WorldArgentinaArmeniaArubaAustraliaAustriaAzerbaijanBahamas, TheBahrainBangladeshBarbadosBelarusBelgiumBelizeBeninBermudaBhutanBoliviaBosnia and HerzegovinaBotswanaBrazilBrunei DarussalamBulgariaBurkina FasoBurundiCabo VerdeCambodiaCameroonCanadaCaribbean small statesCentral African RepublicCentral Europe and the BalticsChadChileChinaColombiaComorosCongo, Dem. Rep.Congo, Rep.Costa RicaCote d'IvoireCroatiaCubaCuracaoCyprusCzech RepublicDenmarkDjiboutiDominicaDominican RepublicEarly-demographic dividendEast Asia & PacificEast Asia & Pacific (excluding high income)East Asia & Pacific (IDA & IBRD countries)EcuadorEgypt, Arab Rep.El SalvadorEquatorial GuineaEritreaEstoniaEthiopiaEuro areaEurope & Central AsiaEurope & Central Asia (excluding high income)Europe & Central Asia (IDA & IBRD countries)European UnionFaroe IslandsFijiFinlandFragile and conflict affected situationsFranceFrench PolynesiaGabonGambia, TheGeorgiaGermanyGhanaGreeceGreenlandGrenadaGuamGuatemalaGuineaGuinea-BissauGuyanaHaitiHeavily indebted poor countries (HIPC)High incomeHondurasHong Kong SAR, ChinaHungaryIBRD onlyIcelandIDA & IBRD totalIDA blendIDA onlyIDA totalIndiaIndonesiaIran, Islamic Rep.IraqIrelandIsraelItalyJamaicaJapanJordanKazakhstanKenyaKiribatiKorea, Dem. People’s Rep.Korea, Rep.KuwaitKyrgyz RepublicLao PDRLate-demographic dividendLatin America & Caribbean Latin America & Caribbean (excluding high income)Latin America & the Caribbean (IDA & IBRD countries)LatviaLeast developed countries: UN classificationLebanonLesothoLiberiaLibyaLithuaniaLow & middle incomeLow incomeLower middle incomeLuxembourgMacao SAR, ChinaMacedonia, FYRMadagascarMalawiMalaysiaMaldivesMaliMaltaMarshall IslandsMauritaniaMauritiusMexicoMicronesia, Fed. Sts.Middle East & North AfricaMiddle East & North Africa (excluding high income)Middle East & North Africa (IDA & IBRD countries)Middle incomeMoldovaMongoliaMontenegroMoroccoMozambiqueMyanmarNamibiaNepalNetherlandsNew CaledoniaNew ZealandNicaraguaNigerNigeriaNorth AmericaNorthern Mariana IslandsNorwayOECD membersOmanOther small statesPacific island small statesPakistanPalauPanamaPapua New GuineaParaguayPeruPhilippinesPolandPortugalPost-demographic dividendPre-demographic dividendQatarRomaniaRussian FederationRwandaSamoaSao Tome and PrincipeSaudi ArabiaSenegalSerbiaSeychellesSierra LeoneSingaporeSint Maarten (Dutch part)Slovak RepublicSloveniaSmall statesSolomon IslandsSouth AfricaSouth AsiaSouth Asia (IDA & IBRD)SpainSri LankaSt. Kitts and NevisSt. LuciaSt. Martin (French part)St. Vincent and the GrenadinesSub-Saharan Africa Sub-Saharan Africa (excluding high income)Sub-Saharan Africa (IDA & IBRD countries)SudanSurinameSwazilandSwedenSwitzerlandSyrian Arab RepublicTajikistanTanzaniaThailandTimor-LesteTogoTongaTrinidad and TobagoTunisiaTurkeyTurkmenistanTuvaluUgandaUkraineUnited Arab EmiratesUnited KingdomUnited StatesUpper middle incomeUruguayUzbekistanVanuatuVenezuela, RBVietnamWorldYemen, Rep.ZambiaZimbabwe Timeline:
This timeline shows a graph from 1961 to 2016 of Lower middle income. No data until 1960. Number of actual observations by date: 56.
Source name:
World Development Indicators
Source organization:
World Trade Organization.
Categories, topics:
Private Sector, Trade
Last updated:
apr 23, 2017
Indicators value changes by year
Minimum:
8.269 bln
jan 1, 1963
Maximum:
1.168 trl
jan 1, 2015
At the date of observation
Value
Absolute change
Change from previous value
jan 1, 1961
8.488 bln
+8.488 bln
0.0%
jan 1, 1962
8.463 bln
-24.045 mln
-0.28%
jan 1, 1963
8.269 bln
-194.692 mln
-2.3%
jan 1, 1964
9.337 bln
+1.069 bln
12.92%
jan 1, 1965
10.046 bln
+709.028 mln
7.59%
jan 1, 1966
10.568 bln
+521.619 mln
5.19%
jan 1, 1967
11.306 bln
+737.953 mln
6.98%
jan 1, 1968
10.662 bln
-643.592 mln
-5.69%
jan 1, 1969
10.964 bln
+301.437 mln
2.83%
jan 1, 1970
12.298 bln
+1.335 bln
12.17%
jan 1, 1971
13.868 bln
+1.57 bln
12.77%
jan 1, 1972
15.151 bln
+1.283 bln
9.25%
jan 1, 1973
17.79 bln
+2.638 bln
17.41%
jan 1, 1974
25.365 bln
+7.575 bln
42.58%
jan 1, 1975
43.418 bln
+18.053 bln
71.17%
jan 1, 1976
40.458 bln
-2.96 bln
-6.82%
jan 1, 1977
49.254 bln
+8.796 bln
21.74%
jan 1, 1978
58.293 bln
+9.039 bln
18.35%
jan 1, 1979
58.889 bln
+595.752 mln
1.02%
jan 1, 1980
80.13 bln
+21.241 bln
36.07%
jan 1, 1981
104.609 bln
+24.479 bln
30.55%
jan 1, 1982
94.095 bln
-10.514 bln
-10.05%
jan 1, 1983
85.551 bln
-8.543 bln
-9.08%
jan 1, 1984
81.918 bln
-3.633 bln
-4.25%
jan 1, 1985
86.118 bln
+4.2 bln
5.13%
jan 1, 1986
81.984 bln
-4.134 bln
-4.8%
jan 1, 1987
71.501 bln
-10.483 bln
-12.79%
jan 1, 1988
82.344 bln
+10.843 bln
15.16%
jan 1, 1989
92.22 bln
+9.875 bln
11.99%
jan 1, 1990
106.941 bln
+14.721 bln
15.96%
jan 1, 1991
121.663 bln
+14.722 bln
13.77%
jan 1, 1992
123.915 bln
+2.253 bln
1.85%
jan 1, 1993
135.33 bln
+11.414 bln
9.21%
jan 1, 1994
141.519 bln
+6.189 bln
4.57%
jan 1, 1995
159.182 bln
+17.663 bln
12.48%
jan 1, 1996
193.097 bln
+33.916 bln
21.31%
jan 1, 1997
215.411 bln
+22.314 bln
11.56%
jan 1, 1998
231.717 bln
+16.306 bln
7.57%
jan 1, 1999
218.939 bln
-12.778 bln
-5.51%
jan 1, 2000
236.365 bln
+17.426 bln
7.96%
jan 1, 2001
284.127 bln
+47.762 bln
20.21%
jan 1, 2002
268.598 bln
-15.529 bln
-5.47%
jan 1, 2003
291.113 bln
+22.515 bln
8.38%
jan 1, 2004
334.122 bln
+43.009 bln
14.77%
jan 1, 2005
413.102 bln
+78.98 bln
23.64%
jan 1, 2006
496.701 bln
+83.599 bln
20.24%
jan 1, 2007
590.106 bln
+93.405 bln
18.81%
jan 1, 2008
689.996 bln
+99.89 bln
16.93%
jan 1, 2009
855.12 bln
+165.123 bln
23.93%
jan 1, 2010
691.967 bln
-163.152 bln
-19.08%
jan 1, 2011
908.429 bln
+216.461 bln
31.28%
jan 1, 2012
1.149 trl
+240.764 bln
26.5%
jan 1, 2013
1.132 trl
-16.989 bln
-1.48%
jan 1, 2014
1.158 trl
+26.132 bln
2.31%
jan 1, 2015
1.168 trl
+10.154 bln
0.88%
jan 1, 2016
986.12 bln
-182.37 bln
-15.61%
Ranking of countries by current statistics by years


Comments: