29
/
en
AIzaSyAYiBZKx7MnpbEhh9jyipgxe19OcubqV5w
April 1, 2024
157556
Iran, Islamic Rep.
IRN
true
2
1
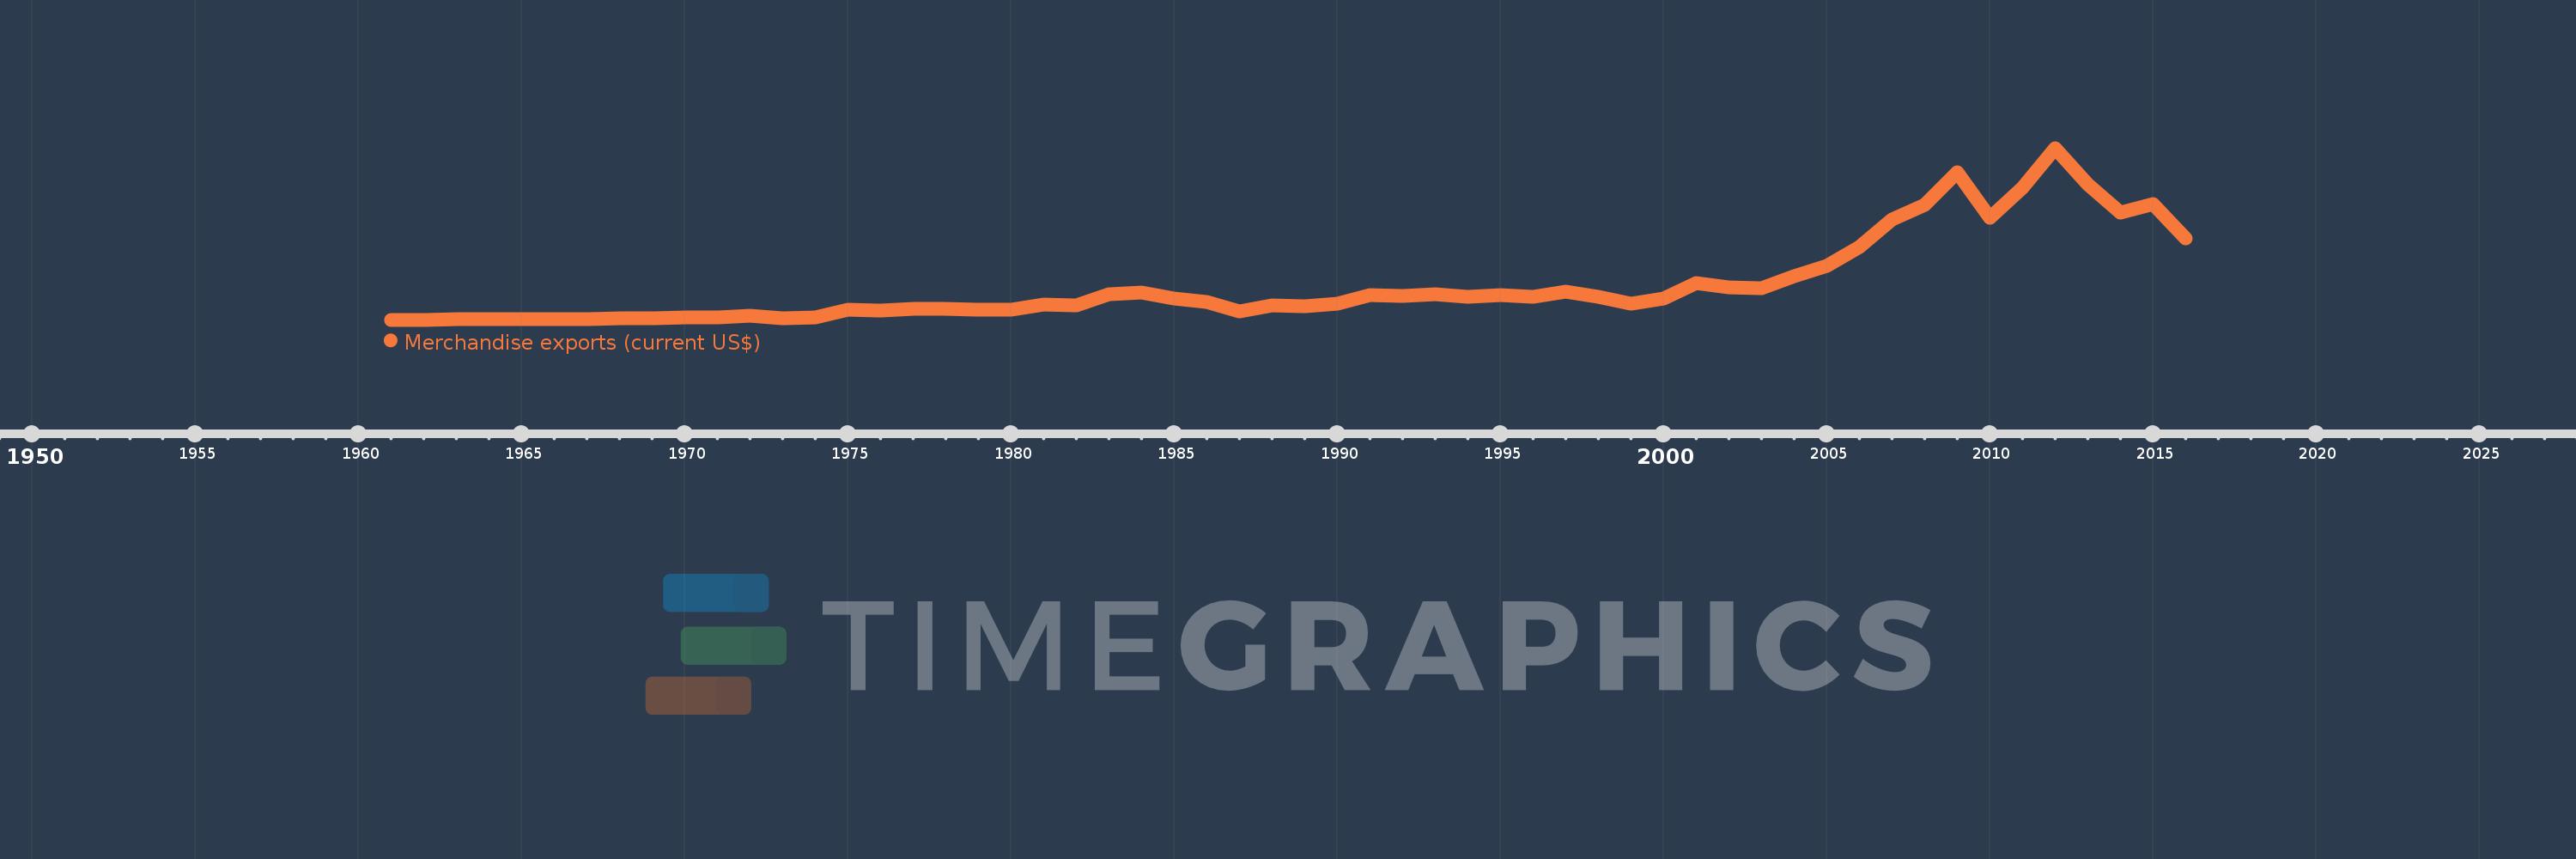
Merchandise exports (current US$)
2016,2015,2014,2013,2012,2011,2010,2009,2008,2007,2006,2005,2004,2003,2002,2001,2000,1999,1998,1997,1996,1995,1994,1993,1992,1991,1990,1989,1988,1987,1986,1985,1984,1983,1982,1981,1980,1979,1978,1977,1976,1975,1974,1973,1972,1971,1970,1969,1968,1967,1966,1965,1964,1963,1962,1961
This statistics in other country:
AfghanistanAlbaniaAlgeriaAmerican SamoaAngolaAntigua and BarbudaArab WorldArgentinaArmeniaArubaAustraliaAustriaAzerbaijanBahamas, TheBahrainBangladeshBarbadosBelarusBelgiumBelizeBeninBermudaBhutanBoliviaBosnia and HerzegovinaBotswanaBrazilBrunei DarussalamBulgariaBurkina FasoBurundiCabo VerdeCambodiaCameroonCanadaCaribbean small statesCentral African RepublicCentral Europe and the BalticsChadChileChinaColombiaComorosCongo, Dem. Rep.Congo, Rep.Costa RicaCote d'IvoireCroatiaCubaCuracaoCyprusCzech RepublicDenmarkDjiboutiDominicaDominican RepublicEarly-demographic dividendEast Asia & PacificEast Asia & Pacific (excluding high income)East Asia & Pacific (IDA & IBRD countries)EcuadorEgypt, Arab Rep.El SalvadorEquatorial GuineaEritreaEstoniaEthiopiaEuro areaEurope & Central AsiaEurope & Central Asia (excluding high income)Europe & Central Asia (IDA & IBRD countries)European UnionFaroe IslandsFijiFinlandFragile and conflict affected situationsFranceFrench PolynesiaGabonGambia, TheGeorgiaGermanyGhanaGreeceGreenlandGrenadaGuamGuatemalaGuineaGuinea-BissauGuyanaHaitiHeavily indebted poor countries (HIPC)High incomeHondurasHong Kong SAR, ChinaHungaryIBRD onlyIcelandIDA & IBRD totalIDA blendIDA onlyIDA totalIndiaIndonesiaIran, Islamic Rep.IraqIrelandIsraelItalyJamaicaJapanJordanKazakhstanKenyaKiribatiKorea, Dem. People’s Rep.Korea, Rep.KuwaitKyrgyz RepublicLao PDRLate-demographic dividendLatin America & Caribbean Latin America & Caribbean (excluding high income)Latin America & the Caribbean (IDA & IBRD countries)LatviaLeast developed countries: UN classificationLebanonLesothoLiberiaLibyaLithuaniaLow & middle incomeLow incomeLower middle incomeLuxembourgMacao SAR, ChinaMacedonia, FYRMadagascarMalawiMalaysiaMaldivesMaliMaltaMarshall IslandsMauritaniaMauritiusMexicoMicronesia, Fed. Sts.Middle East & North AfricaMiddle East & North Africa (excluding high income)Middle East & North Africa (IDA & IBRD countries)Middle incomeMoldovaMongoliaMontenegroMoroccoMozambiqueMyanmarNamibiaNepalNetherlandsNew CaledoniaNew ZealandNicaraguaNigerNigeriaNorth AmericaNorthern Mariana IslandsNorwayOECD membersOmanOther small statesPacific island small statesPakistanPalauPanamaPapua New GuineaParaguayPeruPhilippinesPolandPortugalPost-demographic dividendPre-demographic dividendQatarRomaniaRussian FederationRwandaSamoaSao Tome and PrincipeSaudi ArabiaSenegalSerbiaSeychellesSierra LeoneSingaporeSint Maarten (Dutch part)Slovak RepublicSloveniaSmall statesSolomon IslandsSouth AfricaSouth AsiaSouth Asia (IDA & IBRD)SpainSri LankaSt. Kitts and NevisSt. LuciaSt. Martin (French part)St. Vincent and the GrenadinesSub-Saharan Africa Sub-Saharan Africa (excluding high income)Sub-Saharan Africa (IDA & IBRD countries)SudanSurinameSwazilandSwedenSwitzerlandSyrian Arab RepublicTajikistanTanzaniaThailandTimor-LesteTogoTongaTrinidad and TobagoTunisiaTurkeyTurkmenistanTuvaluUgandaUkraineUnited Arab EmiratesUnited KingdomUnited StatesUpper middle incomeUruguayUzbekistanVanuatuVenezuela, RBVietnamWorldYemen, Rep.ZambiaZimbabwe Timeline:
This timeline shows a graph from 1961 to 2016 of Iran, Islamic Rep.. No data until 1960. Number of actual observations by date: 56.
Source name:
World Development Indicators
Source organization:
World Trade Organization.
Categories, topics:
Private Sector, Trade
Last updated:
apr 23, 2017
Indicators value changes by year
Minimum:
636.3 mln
jan 1, 1961
Maximum:
132.0 bln
jan 1, 2012
At the date of observation
Value
Absolute change
Change from previous value
jan 1, 1961
636.3 mln
+636.3 mln
0.0%
jan 1, 1962
756.283 mln
+119.983 mln
18.86%
jan 1, 1963
822.389 mln
+66.106 mln
8.74%
jan 1, 1964
918.931 mln
+96.542 mln
11.74%
jan 1, 1965
1.252 bln
+333.189 mln
36.26%
jan 1, 1966
1.305 bln
+52.66 mln
4.21%
jan 1, 1967
1.31 bln
+5.25 mln
0.4%
jan 1, 1968
1.929 bln
+619.04 mln
47.25%
jan 1, 1969
1.881 bln
-47.68 mln
-2.47%
jan 1, 1970
2.1 bln
+218.64 mln
11.62%
jan 1, 1971
2.403 bln
+302.77 mln
14.42%
jan 1, 1972
3.824 bln
+1.421 bln
59.14%
jan 1, 1973
1.799 bln
-2.025 bln
-52.95%
jan 1, 1974
2.669 bln
+870.08 mln
48.36%
jan 1, 1975
8.402 bln
+5.732 bln
214.77%
jan 1, 1976
7.963 bln
-438.44 mln
-5.22%
jan 1, 1977
8.935 bln
+971.92 mln
12.21%
jan 1, 1978
9.216 bln
+280.73 mln
3.14%
jan 1, 1979
8.56 bln
-655.24 mln
-7.11%
jan 1, 1980
8.31 bln
-250.4 mln
-2.93%
jan 1, 1981
12.338 bln
+4.028 bln
48.47%
jan 1, 1982
11.831 bln
-507.0 mln
-4.11%
jan 1, 1983
20.452 bln
+8.621 bln
72.87%
jan 1, 1984
21.507 bln
+1.055 bln
5.16%
jan 1, 1985
17.087 bln
-4.42 bln
-20.55%
jan 1, 1986
14.175 bln
-2.912 bln
-17.04%
jan 1, 1987
7.171 bln
-7.004 bln
-49.41%
jan 1, 1988
11.916 bln
+4.745 bln
66.17%
jan 1, 1989
10.709 bln
-1.207 bln
-10.13%
jan 1, 1990
13.081 bln
+2.372 bln
22.15%
jan 1, 1991
19.305 bln
+6.224 bln
47.58%
jan 1, 1992
18.661 bln
-644.0 mln
-3.34%
jan 1, 1993
19.868 bln
+1.207 bln
6.47%
jan 1, 1994
18.08 bln
-1.788 bln
-9.0%
jan 1, 1995
19.434 bln
+1.354 bln
7.49%
jan 1, 1996
18.36 bln
-1.074 bln
-5.53%
jan 1, 1997
22.391 bln
+4.031 bln
21.96%
jan 1, 1998
18.381 bln
-4.01 bln
-17.91%
jan 1, 1999
13.118 bln
-5.263 bln
-28.63%
jan 1, 2000
17.128 bln
+4.01 bln
30.57%
jan 1, 2001
28.739 bln
+11.611 bln
67.79%
jan 1, 2002
25.689 bln
-3.05 bln
-10.61%
jan 1, 2003
24.44 bln
-1.249 bln
-4.86%
jan 1, 2004
33.75 bln
+9.31 bln
38.09%
jan 1, 2005
41.697 bln
+7.947 bln
23.55%
jan 1, 2006
56.252 bln
+14.555 bln
34.91%
jan 1, 2007
77.012 bln
+20.76 bln
36.91%
jan 1, 2008
88.733 bln
+11.721 bln
15.22%
jan 1, 2009
113.668 bln
+24.935 bln
28.1%
jan 1, 2010
78.83 bln
-34.838 bln
-30.65%
jan 1, 2011
101.316 bln
+22.486 bln
28.52%
jan 1, 2012
132.0 bln
+30.684 bln
30.29%
jan 1, 2013
104.0 bln
-28.0 bln
-21.21%
jan 1, 2014
82.5 bln
-21.5 bln
-20.67%
jan 1, 2015
88.8 bln
+6.3 bln
7.64%
jan 1, 2016
63.0 bln
-25.8 bln
-29.05%
Ranking of countries by current statistics by years


Comments: