29
/
en
AIzaSyAYiBZKx7MnpbEhh9jyipgxe19OcubqV5w
April 1, 2024
61812
Upper middle income
UMC
false
2
1
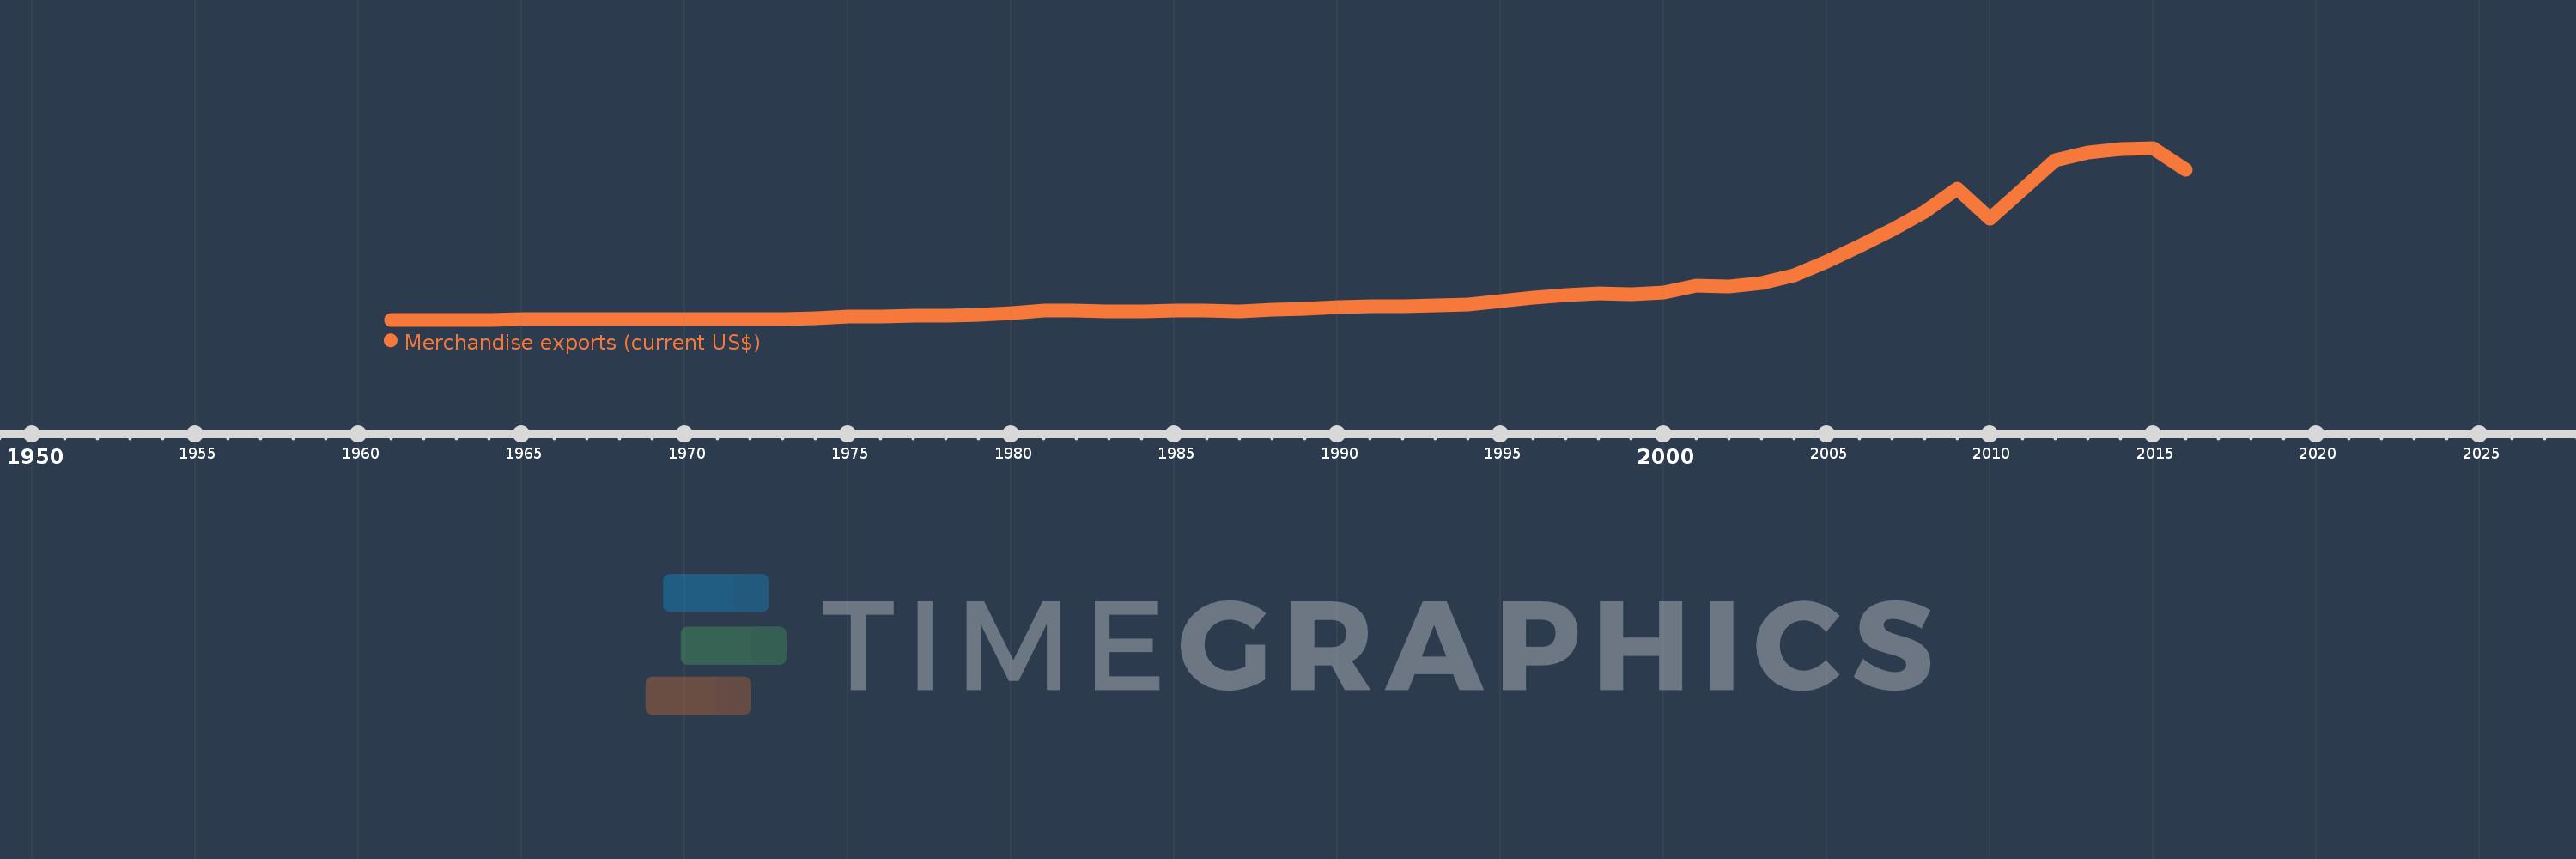
Merchandise exports (current US$)
2016,2015,2014,2013,2012,2011,2010,2009,2008,2007,2006,2005,2004,2003,2002,2001,2000,1999,1998,1997,1996,1995,1994,1993,1992,1991,1990,1989,1988,1987,1986,1985,1984,1983,1982,1981,1980,1979,1978,1977,1976,1975,1974,1973,1972,1971,1970,1969,1968,1967,1966,1965,1964,1963,1962,1961
This statistics in other country:
AfghanistanAlbaniaAlgeriaAmerican SamoaAngolaAntigua and BarbudaArab WorldArgentinaArmeniaArubaAustraliaAustriaAzerbaijanBahamas, TheBahrainBangladeshBarbadosBelarusBelgiumBelizeBeninBermudaBhutanBoliviaBosnia and HerzegovinaBotswanaBrazilBrunei DarussalamBulgariaBurkina FasoBurundiCabo VerdeCambodiaCameroonCanadaCaribbean small statesCentral African RepublicCentral Europe and the BalticsChadChileChinaColombiaComorosCongo, Dem. Rep.Congo, Rep.Costa RicaCote d'IvoireCroatiaCubaCuracaoCyprusCzech RepublicDenmarkDjiboutiDominicaDominican RepublicEarly-demographic dividendEast Asia & PacificEast Asia & Pacific (excluding high income)East Asia & Pacific (IDA & IBRD countries)EcuadorEgypt, Arab Rep.El SalvadorEquatorial GuineaEritreaEstoniaEthiopiaEuro areaEurope & Central AsiaEurope & Central Asia (excluding high income)Europe & Central Asia (IDA & IBRD countries)European UnionFaroe IslandsFijiFinlandFragile and conflict affected situationsFranceFrench PolynesiaGabonGambia, TheGeorgiaGermanyGhanaGreeceGreenlandGrenadaGuamGuatemalaGuineaGuinea-BissauGuyanaHaitiHeavily indebted poor countries (HIPC)High incomeHondurasHong Kong SAR, ChinaHungaryIBRD onlyIcelandIDA & IBRD totalIDA blendIDA onlyIDA totalIndiaIndonesiaIran, Islamic Rep.IraqIrelandIsraelItalyJamaicaJapanJordanKazakhstanKenyaKiribatiKorea, Dem. People’s Rep.Korea, Rep.KuwaitKyrgyz RepublicLao PDRLate-demographic dividendLatin America & Caribbean Latin America & Caribbean (excluding high income)Latin America & the Caribbean (IDA & IBRD countries)LatviaLeast developed countries: UN classificationLebanonLesothoLiberiaLibyaLithuaniaLow & middle incomeLow incomeLower middle incomeLuxembourgMacao SAR, ChinaMacedonia, FYRMadagascarMalawiMalaysiaMaldivesMaliMaltaMarshall IslandsMauritaniaMauritiusMexicoMicronesia, Fed. Sts.Middle East & North AfricaMiddle East & North Africa (excluding high income)Middle East & North Africa (IDA & IBRD countries)Middle incomeMoldovaMongoliaMontenegroMoroccoMozambiqueMyanmarNamibiaNepalNetherlandsNew CaledoniaNew ZealandNicaraguaNigerNigeriaNorth AmericaNorthern Mariana IslandsNorwayOECD membersOmanOther small statesPacific island small statesPakistanPalauPanamaPapua New GuineaParaguayPeruPhilippinesPolandPortugalPost-demographic dividendPre-demographic dividendQatarRomaniaRussian FederationRwandaSamoaSao Tome and PrincipeSaudi ArabiaSenegalSerbiaSeychellesSierra LeoneSingaporeSint Maarten (Dutch part)Slovak RepublicSloveniaSmall statesSolomon IslandsSouth AfricaSouth AsiaSouth Asia (IDA & IBRD)SpainSri LankaSt. Kitts and NevisSt. LuciaSt. Martin (French part)St. Vincent and the GrenadinesSub-Saharan Africa Sub-Saharan Africa (excluding high income)Sub-Saharan Africa (IDA & IBRD countries)SudanSurinameSwazilandSwedenSwitzerlandSyrian Arab RepublicTajikistanTanzaniaThailandTimor-LesteTogoTongaTrinidad and TobagoTunisiaTurkeyTurkmenistanTuvaluUgandaUkraineUnited Arab EmiratesUnited KingdomUnited StatesUpper middle incomeUruguayUzbekistanVanuatuVenezuela, RBVietnamWorldYemen, Rep.ZambiaZimbabwe Timeline:
This timeline shows a graph from 1961 to 2016 of Upper middle income. No data until 1960. Number of actual observations by date: 56.
Source name:
World Development Indicators
Source organization:
World Trade Organization.
Categories, topics:
Private Sector, Trade
Last updated:
apr 23, 2017
Indicators value changes by year
Minimum:
20.074 bln
jan 1, 1962
Maximum:
5.15 trl
jan 1, 2015
At the date of observation
Value
Absolute change
Change from previous value
jan 1, 1961
20.249 bln
+20.249 bln
0.0%
jan 1, 1962
20.074 bln
-175.108 mln
-0.86%
jan 1, 1963
20.825 bln
+751.259 mln
3.74%
jan 1, 1964
23.063 bln
+2.237 bln
10.74%
jan 1, 1965
25.717 bln
+2.655 bln
11.51%
jan 1, 1966
27.195 bln
+1.478 bln
5.75%
jan 1, 1967
28.581 bln
+1.386 bln
5.1%
jan 1, 1968
30.709 bln
+2.127 bln
7.44%
jan 1, 1969
32.577 bln
+1.869 bln
6.08%
jan 1, 1970
36.09 bln
+3.513 bln
10.78%
jan 1, 1971
39.197 bln
+3.106 bln
8.61%
jan 1, 1972
42.805 bln
+3.608 bln
9.21%
jan 1, 1973
47.452 bln
+4.647 bln
10.86%
jan 1, 1974
68.89 bln
+21.438 bln
45.18%
jan 1, 1975
117.593 bln
+48.703 bln
70.7%
jan 1, 1976
116.792 bln
-800.703 mln
-0.68%
jan 1, 1977
129.249 bln
+12.457 bln
10.67%
jan 1, 1978
148.328 bln
+19.079 bln
14.76%
jan 1, 1979
164.761 bln
+16.432 bln
11.08%
jan 1, 1980
227.045 bln
+62.285 bln
37.8%
jan 1, 1981
298.612 bln
+71.566 bln
31.52%
jan 1, 1982
283.92 bln
-14.692 bln
-4.92%
jan 1, 1983
276.767 bln
-7.153 bln
-2.52%
jan 1, 1984
280.38 bln
+3.613 bln
1.31%
jan 1, 1985
299.645 bln
+19.265 bln
6.87%
jan 1, 1986
292.845 bln
-6.8 bln
-2.27%
jan 1, 1987
258.9 bln
-33.945 bln
-11.59%
jan 1, 1988
309.224 bln
+50.324 bln
19.44%
jan 1, 1989
346.339 bln
+37.114 bln
12.0%
jan 1, 1990
385.404 bln
+39.065 bln
11.28%
jan 1, 1991
416.801 bln
+31.397 bln
8.15%
jan 1, 1992
418.17 bln
+1.369 bln
0.33%
jan 1, 1993
453.214 bln
+35.044 bln
8.38%
jan 1, 1994
483.428 bln
+30.214 bln
6.67%
jan 1, 1995
572.851 bln
+89.423 bln
18.5%
jan 1, 1996
690.823 bln
+117.972 bln
20.59%
jan 1, 1997
747.748 bln
+56.925 bln
8.24%
jan 1, 1998
815.078 bln
+67.329 bln
9.0%
jan 1, 1999
770.0 bln
-45.078 bln
-5.53%
jan 1, 2000
833.621 bln
+63.62 bln
8.26%
jan 1, 2001
1.051 trl
+217.057 bln
26.04%
jan 1, 2002
1.025 trl
-25.228 bln
-2.4%
jan 1, 2003
1.113 trl
+87.451 bln
8.53%
jan 1, 2004
1.356 trl
+243.343 bln
21.87%
jan 1, 2005
1.758 trl
+401.584 bln
29.61%
jan 1, 2006
2.208 trl
+449.921 bln
25.6%
jan 1, 2007
2.707 trl
+499.401 bln
22.62%
jan 1, 2008
3.251 trl
+543.752 bln
20.09%
jan 1, 2009
3.947 trl
+696.416 bln
21.42%
jan 1, 2010
3.029 trl
-918.199 bln
-23.26%
jan 1, 2011
3.91 trl
+880.484 bln
29.07%
jan 1, 2012
4.795 trl
+884.946 bln
22.64%
jan 1, 2013
5.013 trl
+218.006 bln
4.55%
jan 1, 2014
5.107 trl
+94.07 bln
1.88%
jan 1, 2015
5.15 trl
+43.815 bln
0.86%
jan 1, 2016
4.504 trl
-646.94 bln
-12.56%
Ranking of countries by current statistics by years


Comments: