29
/
en
AIzaSyAYiBZKx7MnpbEhh9jyipgxe19OcubqV5w
April 1, 2024
134352
France
FRA
true
2
1
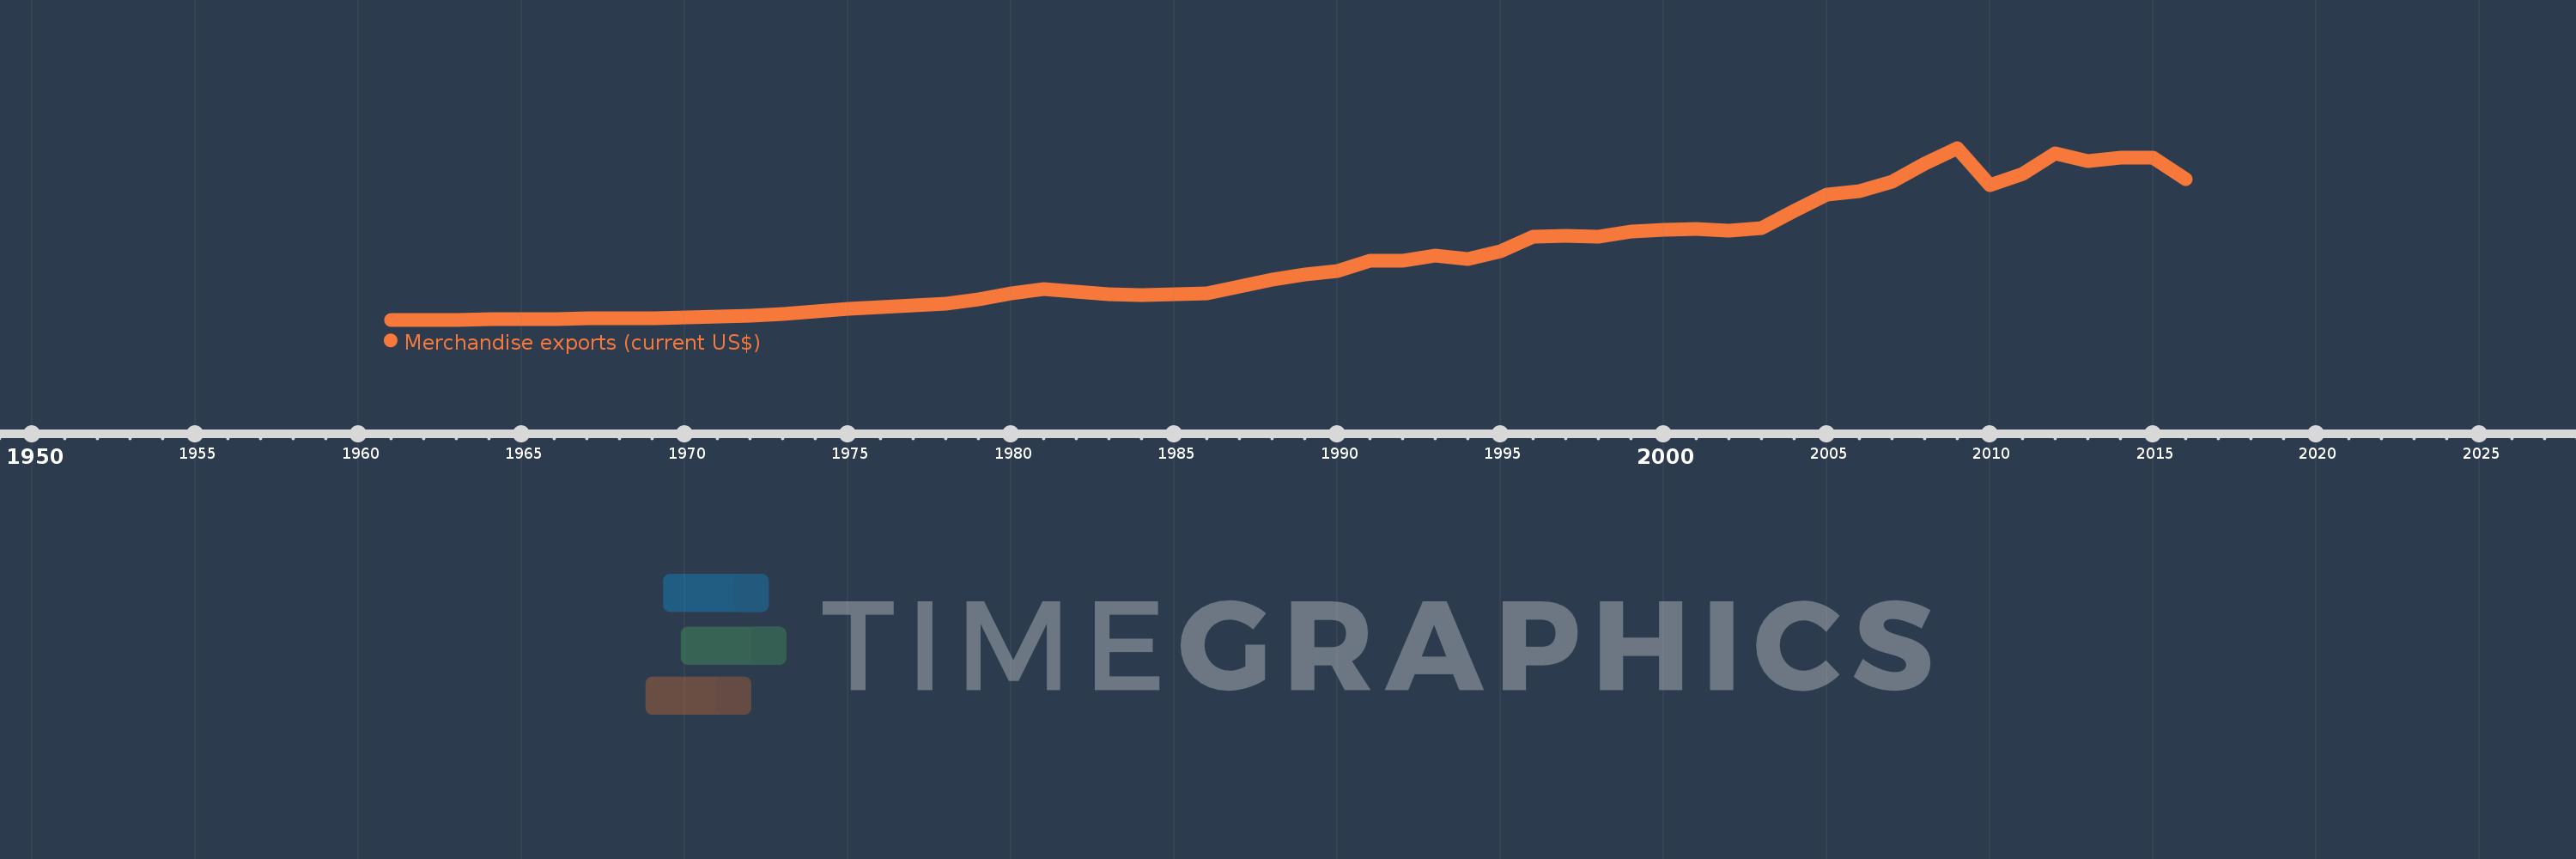
Merchandise exports (current US$)
2016,2015,2014,2013,2012,2011,2010,2009,2008,2007,2006,2005,2004,2003,2002,2001,2000,1999,1998,1997,1996,1995,1994,1993,1992,1991,1990,1989,1988,1987,1986,1985,1984,1983,1982,1981,1980,1979,1978,1977,1976,1975,1974,1973,1972,1971,1970,1969,1968,1967,1966,1965,1964,1963,1962,1961
This statistics in other country:
AfghanistanAlbaniaAlgeriaAmerican SamoaAngolaAntigua and BarbudaArab WorldArgentinaArmeniaArubaAustraliaAustriaAzerbaijanBahamas, TheBahrainBangladeshBarbadosBelarusBelgiumBelizeBeninBermudaBhutanBoliviaBosnia and HerzegovinaBotswanaBrazilBrunei DarussalamBulgariaBurkina FasoBurundiCabo VerdeCambodiaCameroonCanadaCaribbean small statesCentral African RepublicCentral Europe and the BalticsChadChileChinaColombiaComorosCongo, Dem. Rep.Congo, Rep.Costa RicaCote d'IvoireCroatiaCubaCuracaoCyprusCzech RepublicDenmarkDjiboutiDominicaDominican RepublicEarly-demographic dividendEast Asia & PacificEast Asia & Pacific (excluding high income)East Asia & Pacific (IDA & IBRD countries)EcuadorEgypt, Arab Rep.El SalvadorEquatorial GuineaEritreaEstoniaEthiopiaEuro areaEurope & Central AsiaEurope & Central Asia (excluding high income)Europe & Central Asia (IDA & IBRD countries)European UnionFaroe IslandsFijiFinlandFragile and conflict affected situationsFranceFrench PolynesiaGabonGambia, TheGeorgiaGermanyGhanaGreeceGreenlandGrenadaGuamGuatemalaGuineaGuinea-BissauGuyanaHaitiHeavily indebted poor countries (HIPC)High incomeHondurasHong Kong SAR, ChinaHungaryIBRD onlyIcelandIDA & IBRD totalIDA blendIDA onlyIDA totalIndiaIndonesiaIran, Islamic Rep.IraqIrelandIsraelItalyJamaicaJapanJordanKazakhstanKenyaKiribatiKorea, Dem. People’s Rep.Korea, Rep.KuwaitKyrgyz RepublicLao PDRLate-demographic dividendLatin America & Caribbean Latin America & Caribbean (excluding high income)Latin America & the Caribbean (IDA & IBRD countries)LatviaLeast developed countries: UN classificationLebanonLesothoLiberiaLibyaLithuaniaLow & middle incomeLow incomeLower middle incomeLuxembourgMacao SAR, ChinaMacedonia, FYRMadagascarMalawiMalaysiaMaldivesMaliMaltaMarshall IslandsMauritaniaMauritiusMexicoMicronesia, Fed. Sts.Middle East & North AfricaMiddle East & North Africa (excluding high income)Middle East & North Africa (IDA & IBRD countries)Middle incomeMoldovaMongoliaMontenegroMoroccoMozambiqueMyanmarNamibiaNepalNetherlandsNew CaledoniaNew ZealandNicaraguaNigerNigeriaNorth AmericaNorthern Mariana IslandsNorwayOECD membersOmanOther small statesPacific island small statesPakistanPalauPanamaPapua New GuineaParaguayPeruPhilippinesPolandPortugalPost-demographic dividendPre-demographic dividendQatarRomaniaRussian FederationRwandaSamoaSao Tome and PrincipeSaudi ArabiaSenegalSerbiaSeychellesSierra LeoneSingaporeSint Maarten (Dutch part)Slovak RepublicSloveniaSmall statesSolomon IslandsSouth AfricaSouth AsiaSouth Asia (IDA & IBRD)SpainSri LankaSt. Kitts and NevisSt. LuciaSt. Martin (French part)St. Vincent and the GrenadinesSub-Saharan Africa Sub-Saharan Africa (excluding high income)Sub-Saharan Africa (IDA & IBRD countries)SudanSurinameSwazilandSwedenSwitzerlandSyrian Arab RepublicTajikistanTanzaniaThailandTimor-LesteTogoTongaTrinidad and TobagoTunisiaTurkeyTurkmenistanTuvaluUgandaUkraineUnited Arab EmiratesUnited KingdomUnited StatesUpper middle incomeUruguayUzbekistanVanuatuVenezuela, RBVietnamWorldYemen, Rep.ZambiaZimbabwe Timeline:
This timeline shows a graph from 1961 to 2016 of France. No data until 1960. Number of actual observations by date: 56.
Source name:
World Development Indicators
Source organization:
World Trade Organization.
Categories, topics:
Private Sector, Trade
Last updated:
apr 23, 2017
Indicators value changes by year
Minimum:
6.866 bln
jan 1, 1961
Maximum:
616.24 bln
jan 1, 2009
At the date of observation
Value
Absolute change
Change from previous value
jan 1, 1961
6.866 bln
+6.866 bln
0.0%
jan 1, 1962
7.224 bln
+357.91 mln
5.21%
jan 1, 1963
7.411 bln
+186.75 mln
2.59%
jan 1, 1964
8.204 bln
+792.78 mln
10.7%
jan 1, 1965
9.106 bln
+901.75 mln
10.99%
jan 1, 1966
10.176 bln
+1.07 bln
11.76%
jan 1, 1967
10.982 bln
+806.3 mln
7.92%
jan 1, 1968
11.547 bln
+564.4 mln
5.14%
jan 1, 1969
12.903 bln
+1.356 bln
11.74%
jan 1, 1970
15.194 bln
+2.292 bln
17.76%
jan 1, 1971
18.099 bln
+2.904 bln
19.11%
jan 1, 1972
20.811 bln
+2.712 bln
14.98%
jan 1, 1973
26.449 bln
+5.638 bln
27.09%
jan 1, 1974
36.669 bln
+10.22 bln
38.64%
jan 1, 1975
46.259 bln
+9.591 bln
26.15%
jan 1, 1976
53.1 bln
+6.84 bln
14.79%
jan 1, 1977
56.874 bln
+3.774 bln
7.11%
jan 1, 1978
65.13 bln
+8.256 bln
14.52%
jan 1, 1979
79.371 bln
+14.241 bln
21.87%
jan 1, 1980
100.692 bln
+21.321 bln
26.86%
jan 1, 1981
116.03 bln
+15.338 bln
15.23%
jan 1, 1982
106.424 bln
-9.606 bln
-8.28%
jan 1, 1983
96.694 bln
-9.73 bln
-9.14%
jan 1, 1984
94.943 bln
-1.751 bln
-1.81%
jan 1, 1985
97.566 bln
+2.623 bln
2.76%
jan 1, 1986
101.674 bln
+4.108 bln
4.21%
jan 1, 1987
124.948 bln
+23.274 bln
22.89%
jan 1, 1988
148.382 bln
+23.434 bln
18.76%
jan 1, 1989
167.787 bln
+19.405 bln
13.08%
jan 1, 1990
179.397 bln
+11.61 bln
6.92%
jan 1, 1991
216.588 bln
+37.191 bln
20.73%
jan 1, 1992
217.1 bln
+512.0 mln
0.24%
jan 1, 1993
235.871 bln
+18.771 bln
8.65%
jan 1, 1994
221.619 bln
-14.252 bln
-6.04%
jan 1, 1995
250.571 bln
+28.952 bln
13.06%
jan 1, 1996
301.162 bln
+50.591 bln
20.19%
jan 1, 1997
305.509 bln
+4.347 bln
1.44%
jan 1, 1998
302.144 bln
-3.365 bln
-1.1%
jan 1, 1999
320.631 bln
+18.487 bln
6.12%
jan 1, 2000
325.526 bln
+4.895 bln
1.53%
jan 1, 2001
327.611 bln
+2.085 bln
0.64%
jan 1, 2002
323.379 bln
-4.232 bln
-1.29%
jan 1, 2003
331.719 bln
+8.34 bln
2.58%
jan 1, 2004
392.039 bln
+60.32 bln
18.18%
jan 1, 2005
452.106 bln
+60.067 bln
15.32%
jan 1, 2006
463.428 bln
+11.322 bln
2.5%
jan 1, 2007
495.868 bln
+32.44 bln
7.0%
jan 1, 2008
559.612 bln
+63.744 bln
12.86%
jan 1, 2009
616.24 bln
+56.628 bln
10.12%
jan 1, 2010
484.781 bln
-131.459 bln
-21.33%
jan 1, 2011
523.767 bln
+38.986 bln
8.04%
jan 1, 2012
596.473 bln
+72.706 bln
13.88%
jan 1, 2013
568.708 bln
-27.764 bln
-4.65%
jan 1, 2014
580.963 bln
+12.254 bln
2.15%
jan 1, 2015
580.471 bln
-492.197 mln
-0.08%
jan 1, 2016
505.897 bln
-74.574 bln
-12.85%
Ranking of countries by current statistics by years


Comments: