29
/
en
AIzaSyAYiBZKx7MnpbEhh9jyipgxe19OcubqV5w
April 1, 2024
142060
Greece
GRC
true
2
1
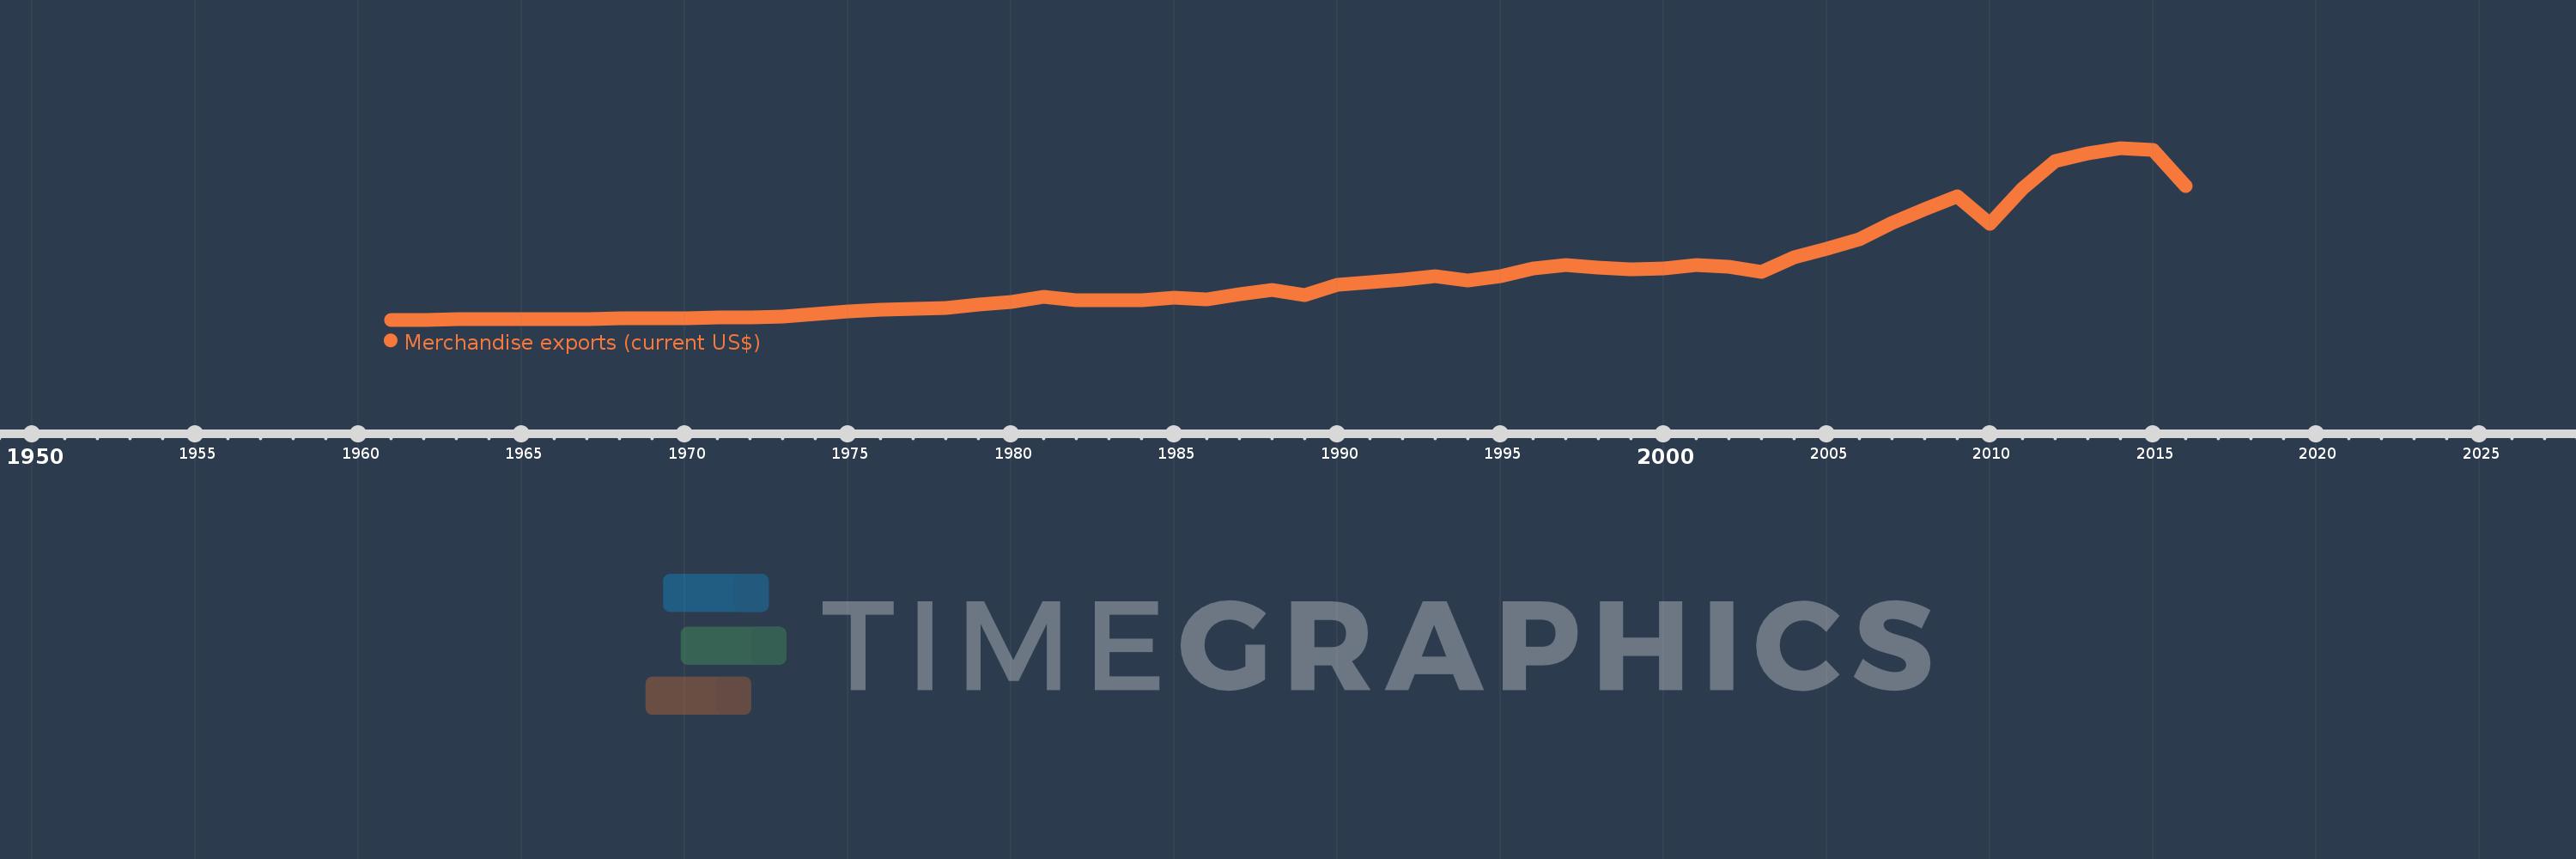
Merchandise exports (current US$)
2016,2015,2014,2013,2012,2011,2010,2009,2008,2007,2006,2005,2004,2003,2002,2001,2000,1999,1998,1997,1996,1995,1994,1993,1992,1991,1990,1989,1988,1987,1986,1985,1984,1983,1982,1981,1980,1979,1978,1977,1976,1975,1974,1973,1972,1971,1970,1969,1968,1967,1966,1965,1964,1963,1962,1961
This statistics in other country:
AfghanistanAlbaniaAlgeriaAmerican SamoaAngolaAntigua and BarbudaArab WorldArgentinaArmeniaArubaAustraliaAustriaAzerbaijanBahamas, TheBahrainBangladeshBarbadosBelarusBelgiumBelizeBeninBermudaBhutanBoliviaBosnia and HerzegovinaBotswanaBrazilBrunei DarussalamBulgariaBurkina FasoBurundiCabo VerdeCambodiaCameroonCanadaCaribbean small statesCentral African RepublicCentral Europe and the BalticsChadChileChinaColombiaComorosCongo, Dem. Rep.Congo, Rep.Costa RicaCote d'IvoireCroatiaCubaCuracaoCyprusCzech RepublicDenmarkDjiboutiDominicaDominican RepublicEarly-demographic dividendEast Asia & PacificEast Asia & Pacific (excluding high income)East Asia & Pacific (IDA & IBRD countries)EcuadorEgypt, Arab Rep.El SalvadorEquatorial GuineaEritreaEstoniaEthiopiaEuro areaEurope & Central AsiaEurope & Central Asia (excluding high income)Europe & Central Asia (IDA & IBRD countries)European UnionFaroe IslandsFijiFinlandFragile and conflict affected situationsFranceFrench PolynesiaGabonGambia, TheGeorgiaGermanyGhanaGreeceGreenlandGrenadaGuamGuatemalaGuineaGuinea-BissauGuyanaHaitiHeavily indebted poor countries (HIPC)High incomeHondurasHong Kong SAR, ChinaHungaryIBRD onlyIcelandIDA & IBRD totalIDA blendIDA onlyIDA totalIndiaIndonesiaIran, Islamic Rep.IraqIrelandIsraelItalyJamaicaJapanJordanKazakhstanKenyaKiribatiKorea, Dem. People’s Rep.Korea, Rep.KuwaitKyrgyz RepublicLao PDRLate-demographic dividendLatin America & Caribbean Latin America & Caribbean (excluding high income)Latin America & the Caribbean (IDA & IBRD countries)LatviaLeast developed countries: UN classificationLebanonLesothoLiberiaLibyaLithuaniaLow & middle incomeLow incomeLower middle incomeLuxembourgMacao SAR, ChinaMacedonia, FYRMadagascarMalawiMalaysiaMaldivesMaliMaltaMarshall IslandsMauritaniaMauritiusMexicoMicronesia, Fed. Sts.Middle East & North AfricaMiddle East & North Africa (excluding high income)Middle East & North Africa (IDA & IBRD countries)Middle incomeMoldovaMongoliaMontenegroMoroccoMozambiqueMyanmarNamibiaNepalNetherlandsNew CaledoniaNew ZealandNicaraguaNigerNigeriaNorth AmericaNorthern Mariana IslandsNorwayOECD membersOmanOther small statesPacific island small statesPakistanPalauPanamaPapua New GuineaParaguayPeruPhilippinesPolandPortugalPost-demographic dividendPre-demographic dividendQatarRomaniaRussian FederationRwandaSamoaSao Tome and PrincipeSaudi ArabiaSenegalSerbiaSeychellesSierra LeoneSingaporeSint Maarten (Dutch part)Slovak RepublicSloveniaSmall statesSolomon IslandsSouth AfricaSouth AsiaSouth Asia (IDA & IBRD)SpainSri LankaSt. Kitts and NevisSt. LuciaSt. Martin (French part)St. Vincent and the GrenadinesSub-Saharan Africa Sub-Saharan Africa (excluding high income)Sub-Saharan Africa (IDA & IBRD countries)SudanSurinameSwazilandSwedenSwitzerlandSyrian Arab RepublicTajikistanTanzaniaThailandTimor-LesteTogoTongaTrinidad and TobagoTunisiaTurkeyTurkmenistanTuvaluUgandaUkraineUnited Arab EmiratesUnited KingdomUnited StatesUpper middle incomeUruguayUzbekistanVanuatuVenezuela, RBVietnamWorldYemen, Rep.ZambiaZimbabwe Timeline:
This timeline shows a graph from 1961 to 2016 of Greece. No data until 1960. Number of actual observations by date: 56.
Source name:
World Development Indicators
Source organization:
World Trade Organization.
Categories, topics:
Private Sector, Trade
Last updated:
apr 23, 2017
Indicators value changes by year
Minimum:
203.2 mln
jan 1, 1961
Maximum:
36.601 bln
jan 1, 2014
At the date of observation
Value
Absolute change
Change from previous value
jan 1, 1961
203.2 mln
+203.2 mln
0.0%
jan 1, 1962
223.333 mln
+20.133 mln
9.91%
jan 1, 1963
250.1 mln
+26.767 mln
11.99%
jan 1, 1964
290.1 mln
+40.0 mln
15.99%
jan 1, 1965
308.533 mln
+18.433 mln
6.35%
jan 1, 1966
327.767 mln
+19.234 mln
6.23%
jan 1, 1967
406.0 mln
+78.233 mln
23.87%
jan 1, 1968
495.2 mln
+89.2 mln
21.97%
jan 1, 1969
467.733 mln
-27.467 mln
-5.55%
jan 1, 1970
553.633 mln
+85.9 mln
18.37%
jan 1, 1971
642.533 mln
+88.9 mln
16.06%
jan 1, 1972
662.467 mln
+19.934 mln
3.1%
jan 1, 1973
870.431 mln
+207.964 mln
31.39%
jan 1, 1974
1.456 bln
+585.709 mln
67.29%
jan 1, 1975
2.03 bln
+573.56 mln
39.39%
jan 1, 1976
2.294 bln
+264.62 mln
13.04%
jan 1, 1977
2.561 bln
+266.79 mln
11.63%
jan 1, 1978
2.756 bln
+195.18 mln
7.62%
jan 1, 1979
3.368 bln
+611.28 mln
22.18%
jan 1, 1980
3.885 bln
+517.31 mln
15.36%
jan 1, 1981
5.153 bln
+1.268 bln
32.64%
jan 1, 1982
4.246 bln
-907.0 mln
-17.6%
jan 1, 1983
4.298 bln
+52.0 mln
1.22%
jan 1, 1984
4.413 bln
+115.0 mln
2.68%
jan 1, 1985
4.816 bln
+403.0 mln
9.13%
jan 1, 1986
4.539 bln
-277.0 mln
-5.75%
jan 1, 1987
5.648 bln
+1.109 bln
24.43%
jan 1, 1988
6.533 bln
+885.0 mln
15.67%
jan 1, 1989
5.429 bln
-1.104 bln
-16.9%
jan 1, 1990
7.545 bln
+2.116 bln
38.98%
jan 1, 1991
8.105 bln
+560.0 mln
7.42%
jan 1, 1992
8.666 bln
+561.0 mln
6.92%
jan 1, 1993
9.51 bln
+844.0 mln
9.74%
jan 1, 1994
8.442 bln
-1.068 bln
-11.23%
jan 1, 1995
9.404 bln
+962.0 mln
11.4%
jan 1, 1996
11.054 bln
+1.65 bln
17.55%
jan 1, 1997
11.711 bln
+657.0 mln
5.94%
jan 1, 1998
11.326 bln
-385.0 mln
-3.29%
jan 1, 1999
10.867 bln
-458.664 mln
-4.05%
jan 1, 2000
11.07 bln
+202.182 mln
1.86%
jan 1, 2001
11.751 bln
+681.054 mln
6.15%
jan 1, 2002
11.507 bln
-243.762 mln
-2.07%
jan 1, 2003
10.414 bln
-1.093 bln
-9.5%
jan 1, 2004
13.382 bln
+2.968 bln
28.5%
jan 1, 2005
15.308 bln
+1.926 bln
14.39%
jan 1, 2006
17.278 bln
+1.971 bln
12.87%
jan 1, 2007
20.749 bln
+3.471 bln
20.09%
jan 1, 2008
23.578 bln
+2.829 bln
13.63%
jan 1, 2009
26.382 bln
+2.804 bln
11.89%
jan 1, 2010
20.469 bln
-5.913 bln
-22.41%
jan 1, 2011
27.95 bln
+7.481 bln
36.55%
jan 1, 2012
33.819 bln
+5.869 bln
21.0%
jan 1, 2013
35.441 bln
+1.622 bln
4.8%
jan 1, 2014
36.601 bln
+1.159 bln
3.27%
jan 1, 2015
36.163 bln
-437.744 mln
-1.2%
jan 1, 2016
28.617 bln
-7.546 bln
-20.87%
Ranking of countries by current statistics by years


Comments: