29
/
en
AIzaSyAYiBZKx7MnpbEhh9jyipgxe19OcubqV5w
April 1, 2024
46297
Low income
LIC
false
2
1
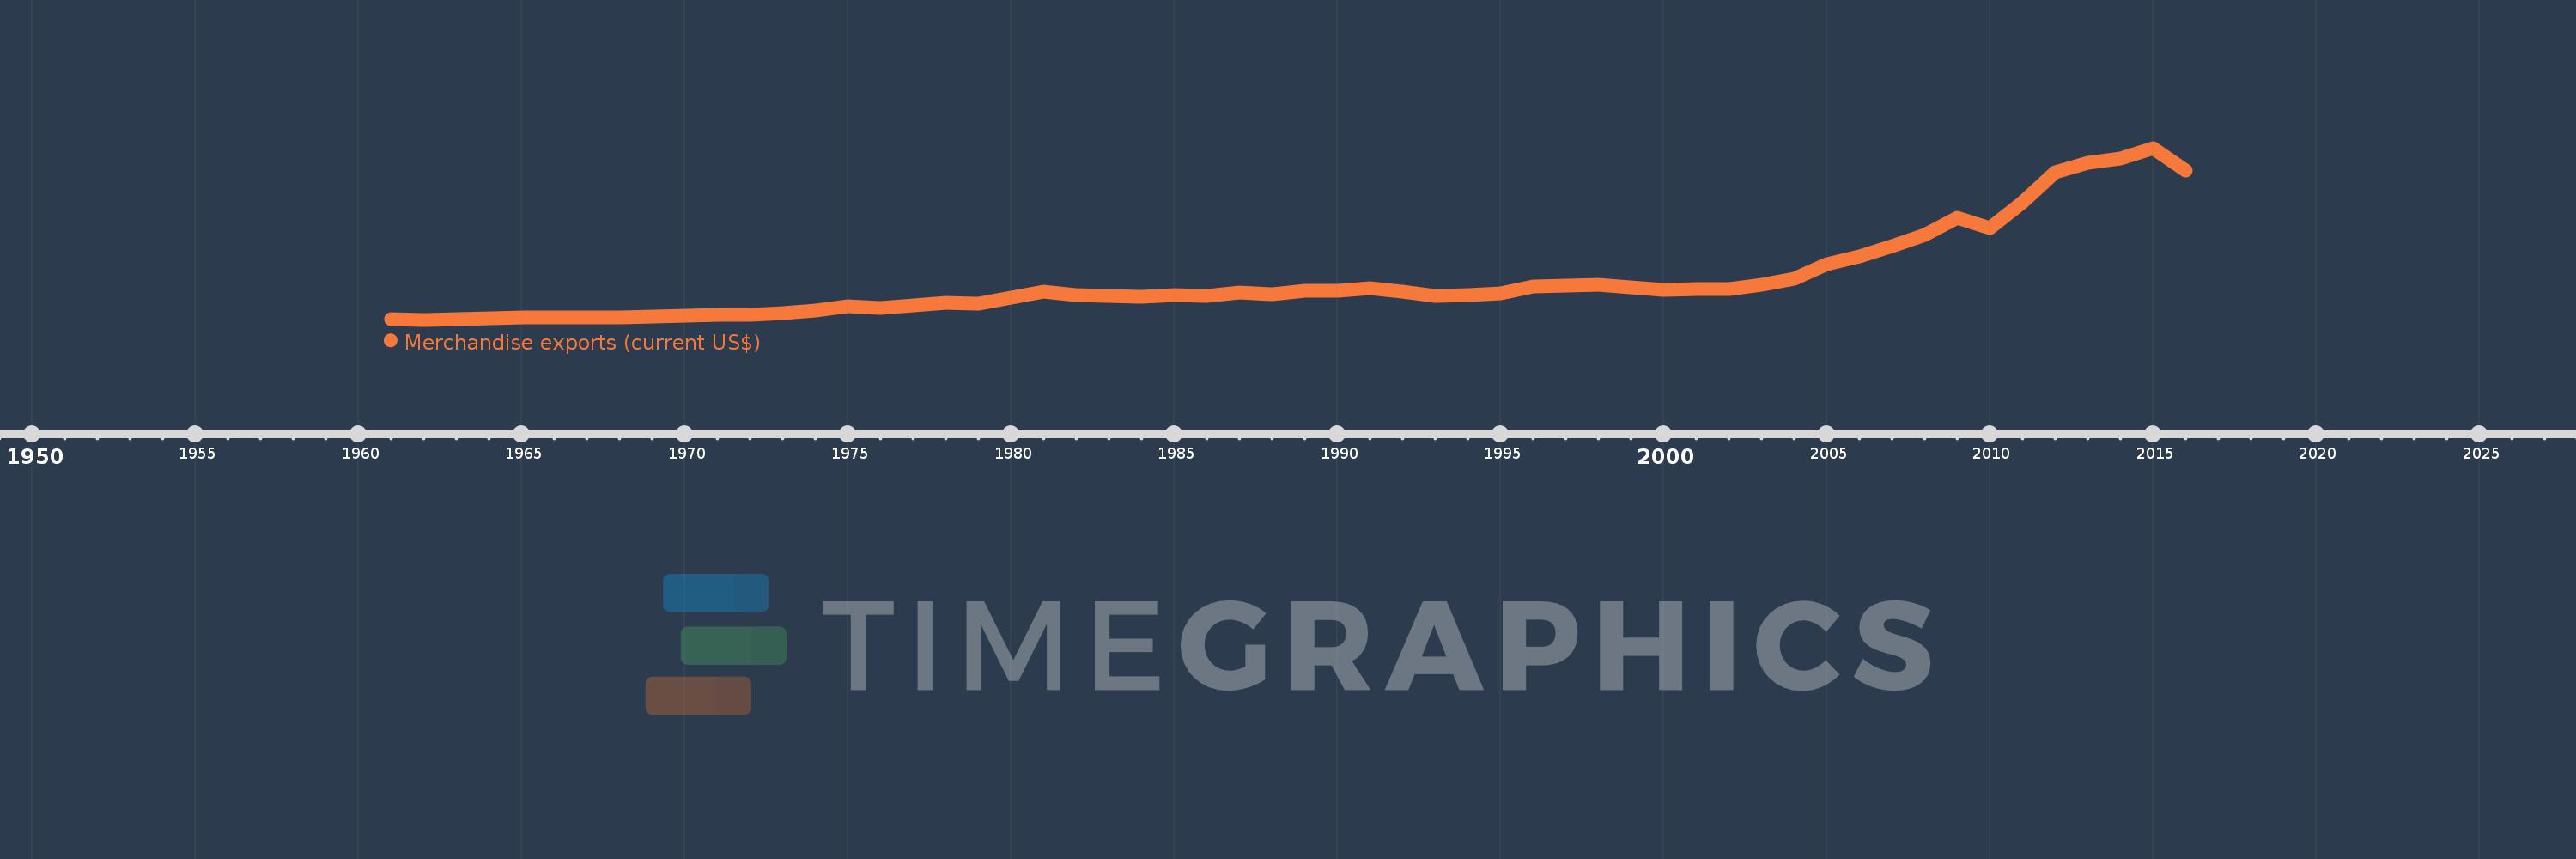
Merchandise exports (current US$)
2016,2015,2014,2013,2012,2011,2010,2009,2008,2007,2006,2005,2004,2003,2002,2001,2000,1999,1998,1997,1996,1995,1994,1993,1992,1991,1990,1989,1988,1987,1986,1985,1984,1983,1982,1981,1980,1979,1978,1977,1976,1975,1974,1973,1972,1971,1970,1969,1968,1967,1966,1965,1964,1963,1962,1961
This statistics in other country:
AfghanistanAlbaniaAlgeriaAmerican SamoaAngolaAntigua and BarbudaArab WorldArgentinaArmeniaArubaAustraliaAustriaAzerbaijanBahamas, TheBahrainBangladeshBarbadosBelarusBelgiumBelizeBeninBermudaBhutanBoliviaBosnia and HerzegovinaBotswanaBrazilBrunei DarussalamBulgariaBurkina FasoBurundiCabo VerdeCambodiaCameroonCanadaCaribbean small statesCentral African RepublicCentral Europe and the BalticsChadChileChinaColombiaComorosCongo, Dem. Rep.Congo, Rep.Costa RicaCote d'IvoireCroatiaCubaCuracaoCyprusCzech RepublicDenmarkDjiboutiDominicaDominican RepublicEarly-demographic dividendEast Asia & PacificEast Asia & Pacific (excluding high income)East Asia & Pacific (IDA & IBRD countries)EcuadorEgypt, Arab Rep.El SalvadorEquatorial GuineaEritreaEstoniaEthiopiaEuro areaEurope & Central AsiaEurope & Central Asia (excluding high income)Europe & Central Asia (IDA & IBRD countries)European UnionFaroe IslandsFijiFinlandFragile and conflict affected situationsFranceFrench PolynesiaGabonGambia, TheGeorgiaGermanyGhanaGreeceGreenlandGrenadaGuamGuatemalaGuineaGuinea-BissauGuyanaHaitiHeavily indebted poor countries (HIPC)High incomeHondurasHong Kong SAR, ChinaHungaryIBRD onlyIcelandIDA & IBRD totalIDA blendIDA onlyIDA totalIndiaIndonesiaIran, Islamic Rep.IraqIrelandIsraelItalyJamaicaJapanJordanKazakhstanKenyaKiribatiKorea, Dem. People’s Rep.Korea, Rep.KuwaitKyrgyz RepublicLao PDRLate-demographic dividendLatin America & Caribbean Latin America & Caribbean (excluding high income)Latin America & the Caribbean (IDA & IBRD countries)LatviaLeast developed countries: UN classificationLebanonLesothoLiberiaLibyaLithuaniaLow & middle incomeLow incomeLower middle incomeLuxembourgMacao SAR, ChinaMacedonia, FYRMadagascarMalawiMalaysiaMaldivesMaliMaltaMarshall IslandsMauritaniaMauritiusMexicoMicronesia, Fed. Sts.Middle East & North AfricaMiddle East & North Africa (excluding high income)Middle East & North Africa (IDA & IBRD countries)Middle incomeMoldovaMongoliaMontenegroMoroccoMozambiqueMyanmarNamibiaNepalNetherlandsNew CaledoniaNew ZealandNicaraguaNigerNigeriaNorth AmericaNorthern Mariana IslandsNorwayOECD membersOmanOther small statesPacific island small statesPakistanPalauPanamaPapua New GuineaParaguayPeruPhilippinesPolandPortugalPost-demographic dividendPre-demographic dividendQatarRomaniaRussian FederationRwandaSamoaSao Tome and PrincipeSaudi ArabiaSenegalSerbiaSeychellesSierra LeoneSingaporeSint Maarten (Dutch part)Slovak RepublicSloveniaSmall statesSolomon IslandsSouth AfricaSouth AsiaSouth Asia (IDA & IBRD)SpainSri LankaSt. Kitts and NevisSt. LuciaSt. Martin (French part)St. Vincent and the GrenadinesSub-Saharan Africa Sub-Saharan Africa (excluding high income)Sub-Saharan Africa (IDA & IBRD countries)SudanSurinameSwazilandSwedenSwitzerlandSyrian Arab RepublicTajikistanTanzaniaThailandTimor-LesteTogoTongaTrinidad and TobagoTunisiaTurkeyTurkmenistanTuvaluUgandaUkraineUnited Arab EmiratesUnited KingdomUnited StatesUpper middle incomeUruguayUzbekistanVanuatuVenezuela, RBVietnamWorldYemen, Rep.ZambiaZimbabwe Timeline:
This timeline shows a graph from 1961 to 2016 of Low income. No data until 1960. Number of actual observations by date: 56.
Source name:
World Development Indicators
Source organization:
World Trade Organization.
Categories, topics:
Private Sector, Trade
Last updated:
apr 23, 2017
Indicators value changes by year
Minimum:
2.126 bln
jan 1, 1962
Maximum:
74.064 bln
jan 1, 2015
At the date of observation
Value
Absolute change
Change from previous value
jan 1, 1961
2.316 bln
+2.316 bln
0.0%
jan 1, 1962
2.126 bln
-189.886 mln
-8.2%
jan 1, 1963
2.209 bln
+82.949 mln
3.9%
jan 1, 1964
2.621 bln
+411.906 mln
18.64%
jan 1, 1965
2.951 bln
+329.985 mln
12.59%
jan 1, 1966
3.065 bln
+113.979 mln
3.86%
jan 1, 1967
3.15 bln
+84.682 mln
2.76%
jan 1, 1968
3.157 bln
+6.713 mln
0.21%
jan 1, 1969
3.444 bln
+287.427 mln
9.11%
jan 1, 1970
3.761 bln
+317.469 mln
9.22%
jan 1, 1971
4.223 bln
+461.371 mln
12.27%
jan 1, 1972
4.157 bln
-65.924 mln
-1.56%
jan 1, 1973
4.875 bln
+717.675 mln
17.26%
jan 1, 1974
6.027 bln
+1.152 bln
23.63%
jan 1, 1975
7.865 bln
+1.839 bln
30.51%
jan 1, 1976
7.223 bln
-642.034 mln
-8.16%
jan 1, 1977
8.039 bln
+816.384 mln
11.3%
jan 1, 1978
9.35 bln
+1.31 bln
16.3%
jan 1, 1979
9.006 bln
-343.347 mln
-3.67%
jan 1, 1980
11.533 bln
+2.527 bln
28.05%
jan 1, 1981
13.753 bln
+2.221 bln
19.25%
jan 1, 1982
12.419 bln
-1.334 bln
-9.7%
jan 1, 1983
11.936 bln
-483.741 mln
-3.9%
jan 1, 1984
11.897 bln
-38.255 mln
-0.32%
jan 1, 1985
12.567 bln
+670.08 mln
5.63%
jan 1, 1986
11.948 bln
-619.484 mln
-4.93%
jan 1, 1987
13.358 bln
+1.41 bln
11.81%
jan 1, 1988
12.977 bln
-381.316 mln
-2.85%
jan 1, 1989
14.2 bln
+1.223 bln
9.42%
jan 1, 1990
14.095 bln
-104.893 mln
-0.74%
jan 1, 1991
15.424 bln
+1.329 bln
9.43%
jan 1, 1992
13.805 bln
-1.619 bln
-10.5%
jan 1, 1993
11.974 bln
-1.832 bln
-13.27%
jan 1, 1994
12.581 bln
+607.105 mln
5.07%
jan 1, 1995
13.252 bln
+670.92 mln
5.33%
jan 1, 1996
15.985 bln
+2.733 bln
20.62%
jan 1, 1997
16.547 bln
+562.188 mln
3.52%
jan 1, 1998
16.841 bln
+293.941 mln
1.78%
jan 1, 1999
15.69 bln
-1.15 bln
-6.83%
jan 1, 2000
14.69 bln
-1.0 bln
-6.38%
jan 1, 2001
15.008 bln
+318.144 mln
2.17%
jan 1, 2002
15.074 bln
+65.556 mln
0.44%
jan 1, 2003
16.717 bln
+1.644 bln
10.9%
jan 1, 2004
19.316 bln
+2.599 bln
15.55%
jan 1, 2005
25.235 bln
+5.919 bln
30.64%
jan 1, 2006
28.801 bln
+3.566 bln
14.13%
jan 1, 2007
32.878 bln
+4.077 bln
14.16%
jan 1, 2008
37.471 bln
+4.593 bln
13.97%
jan 1, 2009
44.987 bln
+7.515 bln
20.06%
jan 1, 2010
40.415 bln
-4.571 bln
-10.16%
jan 1, 2011
51.31 bln
+10.895 bln
26.96%
jan 1, 2012
63.99 bln
+12.679 bln
24.71%
jan 1, 2013
67.954 bln
+3.964 bln
6.19%
jan 1, 2014
69.583 bln
+1.629 bln
2.4%
jan 1, 2015
74.064 bln
+4.482 bln
6.44%
jan 1, 2016
64.723 bln
-9.341 bln
-12.61%
Ranking of countries by current statistics by years


Comments: