29
/
en
AIzaSyAYiBZKx7MnpbEhh9jyipgxe19OcubqV5w
April 1, 2024
112530
Costa Rica
CRI
true
2
1
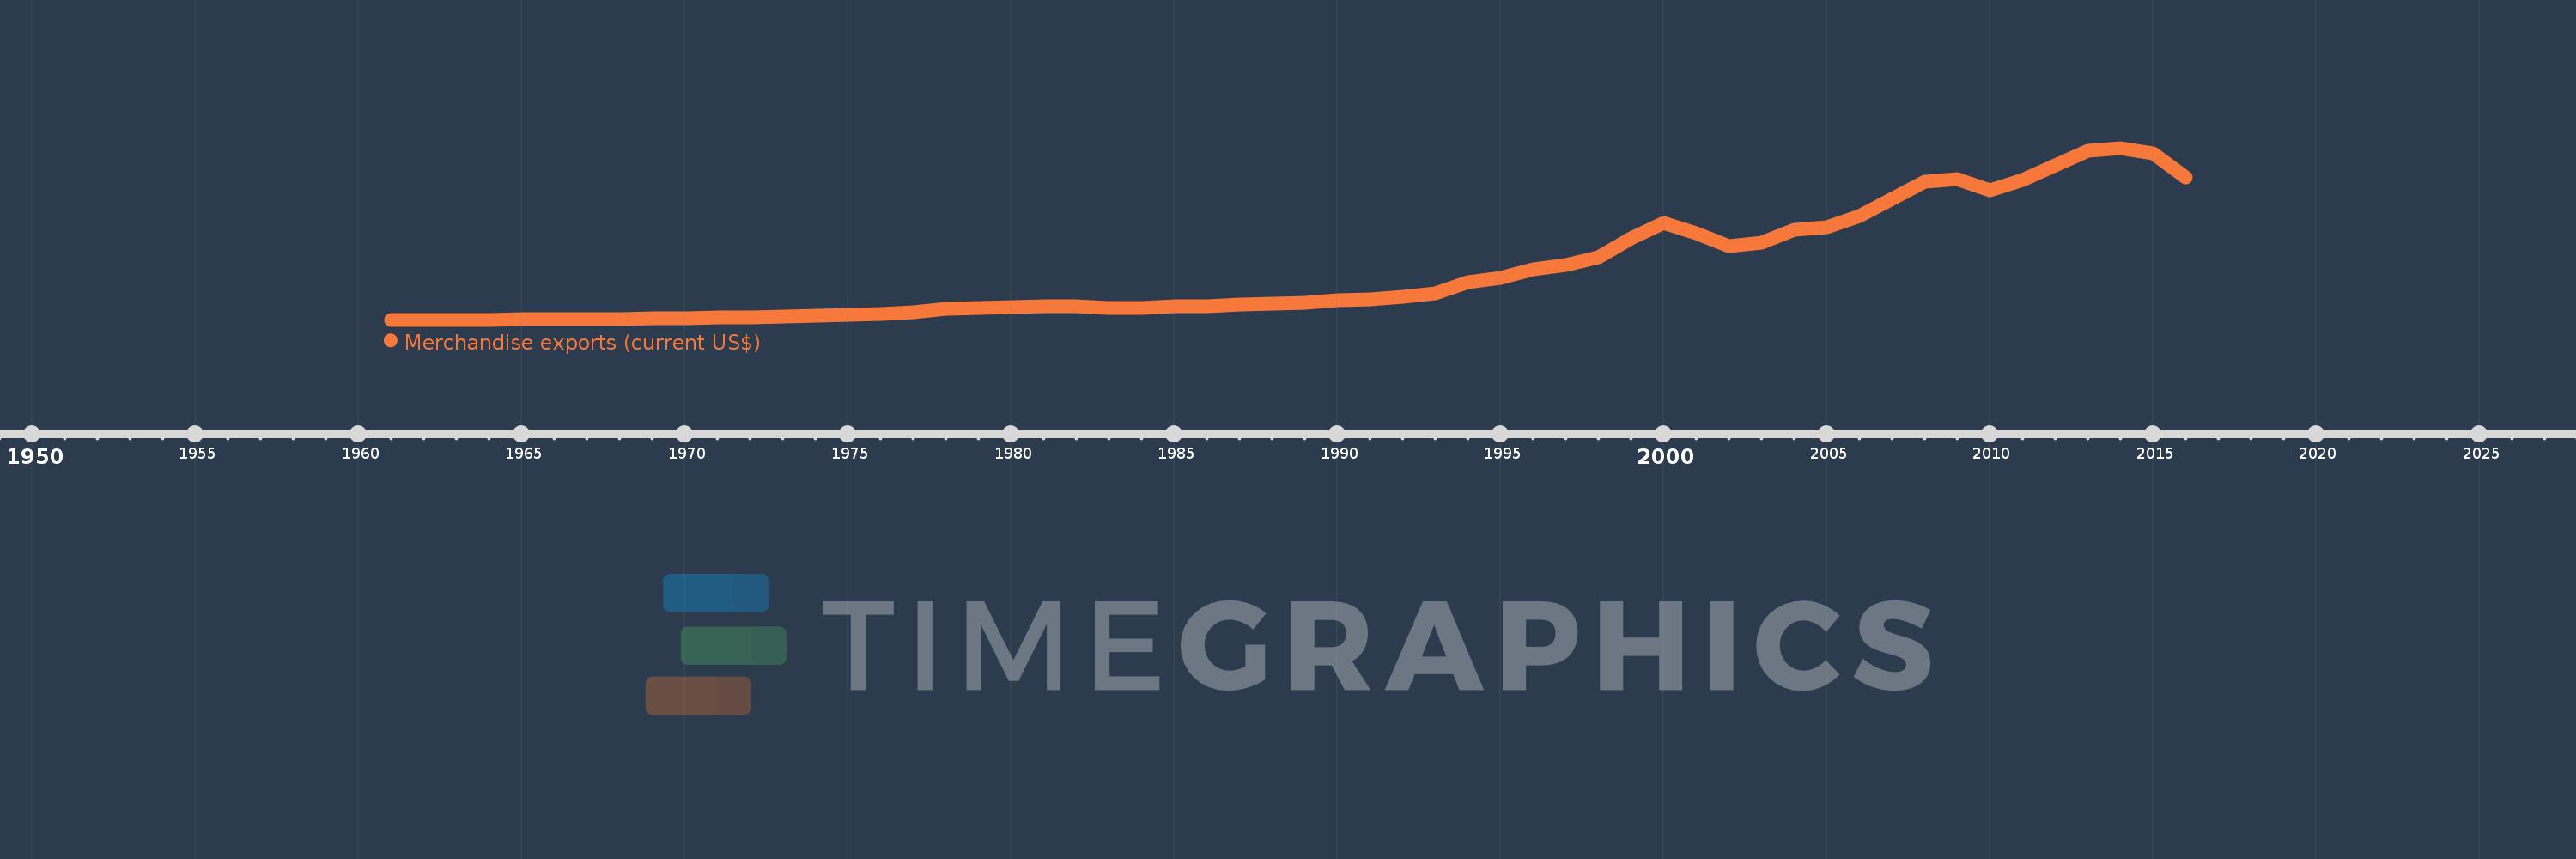
Merchandise exports (current US$)
2016,2015,2014,2013,2012,2011,2010,2009,2008,2007,2006,2005,2004,2003,2002,2001,2000,1999,1998,1997,1996,1995,1994,1993,1992,1991,1990,1989,1988,1987,1986,1985,1984,1983,1982,1981,1980,1979,1978,1977,1976,1975,1974,1973,1972,1971,1970,1969,1968,1967,1966,1965,1964,1963,1962,1961
This statistics in other country:
AfghanistanAlbaniaAlgeriaAmerican SamoaAngolaAntigua and BarbudaArab WorldArgentinaArmeniaArubaAustraliaAustriaAzerbaijanBahamas, TheBahrainBangladeshBarbadosBelarusBelgiumBelizeBeninBermudaBhutanBoliviaBosnia and HerzegovinaBotswanaBrazilBrunei DarussalamBulgariaBurkina FasoBurundiCabo VerdeCambodiaCameroonCanadaCaribbean small statesCentral African RepublicCentral Europe and the BalticsChadChileChinaColombiaComorosCongo, Dem. Rep.Congo, Rep.Costa RicaCote d'IvoireCroatiaCubaCuracaoCyprusCzech RepublicDenmarkDjiboutiDominicaDominican RepublicEarly-demographic dividendEast Asia & PacificEast Asia & Pacific (excluding high income)East Asia & Pacific (IDA & IBRD countries)EcuadorEgypt, Arab Rep.El SalvadorEquatorial GuineaEritreaEstoniaEthiopiaEuro areaEurope & Central AsiaEurope & Central Asia (excluding high income)Europe & Central Asia (IDA & IBRD countries)European UnionFaroe IslandsFijiFinlandFragile and conflict affected situationsFranceFrench PolynesiaGabonGambia, TheGeorgiaGermanyGhanaGreeceGreenlandGrenadaGuamGuatemalaGuineaGuinea-BissauGuyanaHaitiHeavily indebted poor countries (HIPC)High incomeHondurasHong Kong SAR, ChinaHungaryIBRD onlyIcelandIDA & IBRD totalIDA blendIDA onlyIDA totalIndiaIndonesiaIran, Islamic Rep.IraqIrelandIsraelItalyJamaicaJapanJordanKazakhstanKenyaKiribatiKorea, Dem. People’s Rep.Korea, Rep.KuwaitKyrgyz RepublicLao PDRLate-demographic dividendLatin America & Caribbean Latin America & Caribbean (excluding high income)Latin America & the Caribbean (IDA & IBRD countries)LatviaLeast developed countries: UN classificationLebanonLesothoLiberiaLibyaLithuaniaLow & middle incomeLow incomeLower middle incomeLuxembourgMacao SAR, ChinaMacedonia, FYRMadagascarMalawiMalaysiaMaldivesMaliMaltaMarshall IslandsMauritaniaMauritiusMexicoMicronesia, Fed. Sts.Middle East & North AfricaMiddle East & North Africa (excluding high income)Middle East & North Africa (IDA & IBRD countries)Middle incomeMoldovaMongoliaMontenegroMoroccoMozambiqueMyanmarNamibiaNepalNetherlandsNew CaledoniaNew ZealandNicaraguaNigerNigeriaNorth AmericaNorthern Mariana IslandsNorwayOECD membersOmanOther small statesPacific island small statesPakistanPalauPanamaPapua New GuineaParaguayPeruPhilippinesPolandPortugalPost-demographic dividendPre-demographic dividendQatarRomaniaRussian FederationRwandaSamoaSao Tome and PrincipeSaudi ArabiaSenegalSerbiaSeychellesSierra LeoneSingaporeSint Maarten (Dutch part)Slovak RepublicSloveniaSmall statesSolomon IslandsSouth AfricaSouth AsiaSouth Asia (IDA & IBRD)SpainSri LankaSt. Kitts and NevisSt. LuciaSt. Martin (French part)St. Vincent and the GrenadinesSub-Saharan Africa Sub-Saharan Africa (excluding high income)Sub-Saharan Africa (IDA & IBRD countries)SudanSurinameSwazilandSwedenSwitzerlandSyrian Arab RepublicTajikistanTanzaniaThailandTimor-LesteTogoTongaTrinidad and TobagoTunisiaTurkeyTurkmenistanTuvaluUgandaUkraineUnited Arab EmiratesUnited KingdomUnited StatesUpper middle incomeUruguayUzbekistanVanuatuVenezuela, RBVietnamWorldYemen, Rep.ZambiaZimbabwe Timeline:
This timeline shows a graph from 1961 to 2016 of Costa Rica. No data until 1960. Number of actual observations by date: 56.
Source name:
World Development Indicators
Source organization:
World Trade Organization.
Categories, topics:
Private Sector, Trade
Last updated:
apr 23, 2017
Indicators value changes by year
Minimum:
84.2 mln
jan 1, 1962
Maximum:
11.603 bln
jan 1, 2014
At the date of observation
Value
Absolute change
Change from previous value
jan 1, 1961
84.3 mln
+84.3 mln
0.0%
jan 1, 1962
84.2 mln
-100.0K
-0.12%
jan 1, 1963
93.0 mln
+8.8 mln
10.45%
jan 1, 1964
95.0 mln
+2.0 mln
2.15%
jan 1, 1965
113.9 mln
+18.9 mln
19.89%
jan 1, 1966
111.8 mln
-2.1 mln
-1.84%
jan 1, 1967
135.5 mln
+23.7 mln
21.2%
jan 1, 1968
143.8 mln
+8.3 mln
6.13%
jan 1, 1969
170.8 mln
+27.0 mln
18.78%
jan 1, 1970
189.7 mln
+18.9 mln
11.07%
jan 1, 1971
231.2 mln
+41.5 mln
21.88%
jan 1, 1972
225.4 mln
-5.8 mln
-2.51%
jan 1, 1973
280.9 mln
+55.5 mln
24.62%
jan 1, 1974
344.5 mln
+63.6 mln
22.64%
jan 1, 1975
440.3 mln
+95.8 mln
27.81%
jan 1, 1976
493.3 mln
+53.0 mln
12.04%
jan 1, 1977
592.9 mln
+99.6 mln
20.19%
jan 1, 1978
828.2 mln
+235.3 mln
39.69%
jan 1, 1979
864.9 mln
+36.7 mln
4.43%
jan 1, 1980
934.4 mln
+69.5 mln
8.04%
jan 1, 1981
1.002 bln
+67.6 mln
7.23%
jan 1, 1982
1.008 bln
+6.0 mln
0.6%
jan 1, 1983
870.0 mln
-138.0 mln
-13.69%
jan 1, 1984
873.0 mln
+3.0 mln
0.34%
jan 1, 1985
1.006 bln
+133.0 mln
15.23%
jan 1, 1986
976.0 mln
-30.0 mln
-2.98%
jan 1, 1987
1.121 bln
+145.0 mln
14.86%
jan 1, 1988
1.158 bln
+37.0 mln
3.3%
jan 1, 1989
1.246 bln
+88.0 mln
7.6%
jan 1, 1990
1.415 bln
+169.0 mln
13.56%
jan 1, 1991
1.448 bln
+33.0 mln
2.33%
jan 1, 1992
1.598 bln
+150.0 mln
10.36%
jan 1, 1993
1.841 bln
+243.0 mln
15.21%
jan 1, 1994
2.625 bln
+784.0 mln
42.59%
jan 1, 1995
2.869 bln
+244.0 mln
9.3%
jan 1, 1996
3.453 bln
+584.0 mln
20.36%
jan 1, 1997
3.73 bln
+277.0 mln
8.02%
jan 1, 1998
4.268 bln
+538.0 mln
14.42%
jan 1, 1999
5.511 bln
+1.243 bln
29.12%
jan 1, 2000
6.577 bln
+1.066 bln
19.34%
jan 1, 2001
5.865 bln
-712.0 mln
-10.83%
jan 1, 2002
5.021 bln
-844.0 mln
-14.39%
jan 1, 2003
5.264 bln
+243.0 mln
4.84%
jan 1, 2004
6.102 bln
+838.2 mln
15.92%
jan 1, 2005
6.301 bln
+199.27 mln
3.27%
jan 1, 2006
7.026 bln
+724.93 mln
11.5%
jan 1, 2007
8.2 bln
+1.174 bln
16.7%
jan 1, 2008
9.337 bln
+1.137 bln
13.87%
jan 1, 2009
9.504 bln
+166.7 mln
1.79%
jan 1, 2010
8.784 bln
-720.0 mln
-7.58%
jan 1, 2011
9.448 bln
+664.4 mln
7.56%
jan 1, 2012
10.408 bln
+960.3 mln
10.16%
jan 1, 2013
11.433 bln
+1.025 bln
9.85%
jan 1, 2014
11.603 bln
+169.8 mln
1.49%
jan 1, 2015
11.252 bln
-351.347 mln
-3.03%
jan 1, 2016
9.624 bln
-1.628 bln
-14.47%
Ranking of countries by current statistics by years


Comments: