29
/
en
AIzaSyAYiBZKx7MnpbEhh9jyipgxe19OcubqV5w
April 1, 2024
24279
Arab World
ARB
false
2
1
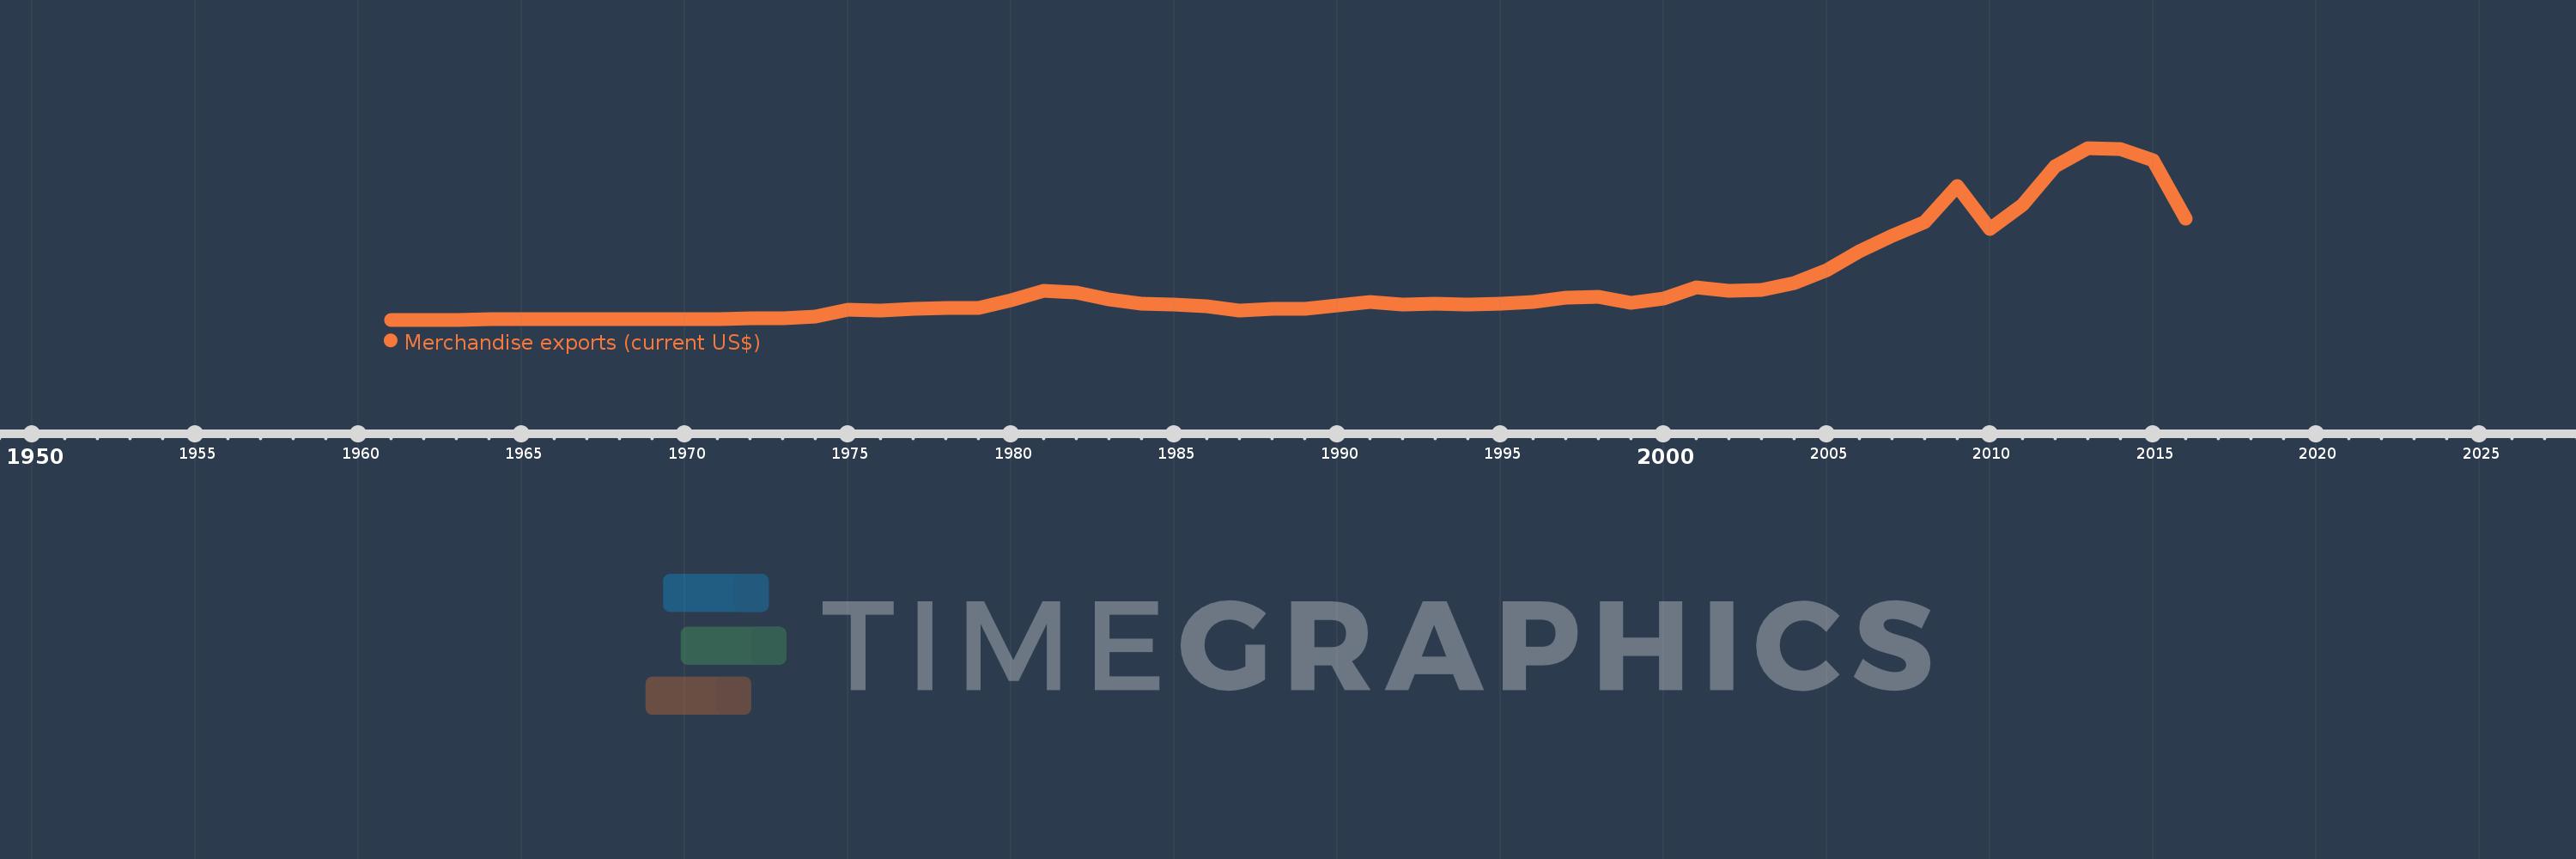
Merchandise exports (current US$)
2016,2015,2014,2013,2012,2011,2010,2009,2008,2007,2006,2005,2004,2003,2002,2001,2000,1999,1998,1997,1996,1995,1994,1993,1992,1991,1990,1989,1988,1987,1986,1985,1984,1983,1982,1981,1980,1979,1978,1977,1976,1975,1974,1973,1972,1971,1970,1969,1968,1967,1966,1965,1964,1963,1962,1961
This statistics in other country:
AfghanistanAlbaniaAlgeriaAmerican SamoaAngolaAntigua and BarbudaArab WorldArgentinaArmeniaArubaAustraliaAustriaAzerbaijanBahamas, TheBahrainBangladeshBarbadosBelarusBelgiumBelizeBeninBermudaBhutanBoliviaBosnia and HerzegovinaBotswanaBrazilBrunei DarussalamBulgariaBurkina FasoBurundiCabo VerdeCambodiaCameroonCanadaCaribbean small statesCentral African RepublicCentral Europe and the BalticsChadChileChinaColombiaComorosCongo, Dem. Rep.Congo, Rep.Costa RicaCote d'IvoireCroatiaCubaCuracaoCyprusCzech RepublicDenmarkDjiboutiDominicaDominican RepublicEarly-demographic dividendEast Asia & PacificEast Asia & Pacific (excluding high income)East Asia & Pacific (IDA & IBRD countries)EcuadorEgypt, Arab Rep.El SalvadorEquatorial GuineaEritreaEstoniaEthiopiaEuro areaEurope & Central AsiaEurope & Central Asia (excluding high income)Europe & Central Asia (IDA & IBRD countries)European UnionFaroe IslandsFijiFinlandFragile and conflict affected situationsFranceFrench PolynesiaGabonGambia, TheGeorgiaGermanyGhanaGreeceGreenlandGrenadaGuamGuatemalaGuineaGuinea-BissauGuyanaHaitiHeavily indebted poor countries (HIPC)High incomeHondurasHong Kong SAR, ChinaHungaryIBRD onlyIcelandIDA & IBRD totalIDA blendIDA onlyIDA totalIndiaIndonesiaIran, Islamic Rep.IraqIrelandIsraelItalyJamaicaJapanJordanKazakhstanKenyaKiribatiKorea, Dem. People’s Rep.Korea, Rep.KuwaitKyrgyz RepublicLao PDRLate-demographic dividendLatin America & Caribbean Latin America & Caribbean (excluding high income)Latin America & the Caribbean (IDA & IBRD countries)LatviaLeast developed countries: UN classificationLebanonLesothoLiberiaLibyaLithuaniaLow & middle incomeLow incomeLower middle incomeLuxembourgMacao SAR, ChinaMacedonia, FYRMadagascarMalawiMalaysiaMaldivesMaliMaltaMarshall IslandsMauritaniaMauritiusMexicoMicronesia, Fed. Sts.Middle East & North AfricaMiddle East & North Africa (excluding high income)Middle East & North Africa (IDA & IBRD countries)Middle incomeMoldovaMongoliaMontenegroMoroccoMozambiqueMyanmarNamibiaNepalNetherlandsNew CaledoniaNew ZealandNicaraguaNigerNigeriaNorth AmericaNorthern Mariana IslandsNorwayOECD membersOmanOther small statesPacific island small statesPakistanPalauPanamaPapua New GuineaParaguayPeruPhilippinesPolandPortugalPost-demographic dividendPre-demographic dividendQatarRomaniaRussian FederationRwandaSamoaSao Tome and PrincipeSaudi ArabiaSenegalSerbiaSeychellesSierra LeoneSingaporeSint Maarten (Dutch part)Slovak RepublicSloveniaSmall statesSolomon IslandsSouth AfricaSouth AsiaSouth Asia (IDA & IBRD)SpainSri LankaSt. Kitts and NevisSt. LuciaSt. Martin (French part)St. Vincent and the GrenadinesSub-Saharan Africa Sub-Saharan Africa (excluding high income)Sub-Saharan Africa (IDA & IBRD countries)SudanSurinameSwazilandSwedenSwitzerlandSyrian Arab RepublicTajikistanTanzaniaThailandTimor-LesteTogoTongaTrinidad and TobagoTunisiaTurkeyTurkmenistanTuvaluUgandaUkraineUnited Arab EmiratesUnited KingdomUnited StatesUpper middle incomeUruguayUzbekistanVanuatuVenezuela, RBVietnamWorldYemen, Rep.ZambiaZimbabwe Timeline:
This timeline shows a graph from 1961 to 2016 of Arab World. No data until 1960. Number of actual observations by date: 56.
Source name:
World Development Indicators
Source organization:
World Trade Organization.
Categories, topics:
Private Sector, Trade
Last updated:
apr 23, 2017
Indicators value changes by year
Minimum:
4.644 bln
jan 1, 1961
Maximum:
1.39 trl
jan 1, 2013
At the date of observation
Value
Absolute change
Change from previous value
jan 1, 1961
4.644 bln
+4.644 bln
0.0%
jan 1, 1962
4.645 bln
+451.482K
0.01%
jan 1, 1963
4.908 bln
+263.603 mln
5.68%
jan 1, 1964
6.163 bln
+1.255 bln
25.58%
jan 1, 1965
6.85 bln
+686.099 mln
11.13%
jan 1, 1966
7.253 bln
+403.23 mln
5.89%
jan 1, 1967
7.963 bln
+710.104 mln
9.79%
jan 1, 1968
7.788 bln
-174.608 mln
-2.19%
jan 1, 1969
9.273 bln
+1.485 bln
19.07%
jan 1, 1970
10.253 bln
+979.714 mln
10.56%
jan 1, 1971
11.809 bln
+1.556 bln
15.18%
jan 1, 1972
14.945 bln
+3.136 bln
26.55%
jan 1, 1973
17.83 bln
+2.885 bln
19.31%
jan 1, 1974
28.342 bln
+10.512 bln
58.96%
jan 1, 1975
84.161 bln
+55.819 bln
196.95%
jan 1, 1976
76.993 bln
-7.168 bln
-8.52%
jan 1, 1977
93.017 bln
+16.025 bln
20.81%
jan 1, 1978
102.041 bln
+9.024 bln
9.7%
jan 1, 1979
100.443 bln
-1.598 bln
-1.57%
jan 1, 1980
160.136 bln
+59.693 bln
59.43%
jan 1, 1981
238.794 bln
+78.658 bln
49.12%
jan 1, 1982
227.07 bln
-11.724 bln
-4.91%
jan 1, 1983
170.282 bln
-56.788 bln
-25.01%
jan 1, 1984
131.64 bln
-38.642 bln
-22.69%
jan 1, 1985
124.572 bln
-7.068 bln
-5.37%
jan 1, 1986
115.389 bln
-9.183 bln
-7.37%
jan 1, 1987
81.054 bln
-34.335 bln
-29.76%
jan 1, 1988
93.567 bln
+12.512 bln
15.44%
jan 1, 1989
94.036 bln
+469.314 mln
0.5%
jan 1, 1990
117.626 bln
+23.59 bln
25.09%
jan 1, 1991
145.41 bln
+27.785 bln
23.62%
jan 1, 1992
127.405 bln
-18.005 bln
-12.38%
jan 1, 1993
133.386 bln
+5.981 bln
4.69%
jan 1, 1994
127.215 bln
-6.171 bln
-4.63%
jan 1, 1995
131.583 bln
+4.368 bln
3.43%
jan 1, 1996
149.816 bln
+18.233 bln
13.86%
jan 1, 1997
180.011 bln
+30.195 bln
20.15%
jan 1, 1998
187.709 bln
+7.698 bln
4.28%
jan 1, 1999
142.372 bln
-45.337 bln
-24.15%
jan 1, 2000
177.99 bln
+35.618 bln
25.02%
jan 1, 2001
264.245 bln
+86.255 bln
48.46%
jan 1, 2002
236.091 bln
-28.155 bln
-10.65%
jan 1, 2003
245.4 bln
+9.309 bln
3.94%
jan 1, 2004
301.96 bln
+56.56 bln
23.05%
jan 1, 2005
406.05 bln
+104.091 bln
34.47%
jan 1, 2006
560.045 bln
+153.995 bln
37.93%
jan 1, 2007
679.281 bln
+119.236 bln
21.29%
jan 1, 2008
791.205 bln
+111.924 bln
16.48%
jan 1, 2009
1.081 trl
+289.471 bln
36.59%
jan 1, 2010
739.354 bln
-341.322 bln
-31.58%
jan 1, 2011
927.651 bln
+188.297 bln
25.47%
jan 1, 2012
1.244 trl
+316.345 bln
34.1%
jan 1, 2013
1.39 trl
+145.828 bln
11.72%
jan 1, 2014
1.382 trl
-8.093 bln
-0.58%
jan 1, 2015
1.288 trl
-94.072 bln
-6.81%
jan 1, 2016
822.081 bln
-465.577 bln
-36.16%
Ranking of countries by current statistics by years


Comments: