29
/
en
AIzaSyAYiBZKx7MnpbEhh9jyipgxe19OcubqV5w
April 1, 2024
58294
South Asia (IDA & IBRD)
TSA
false
2
1
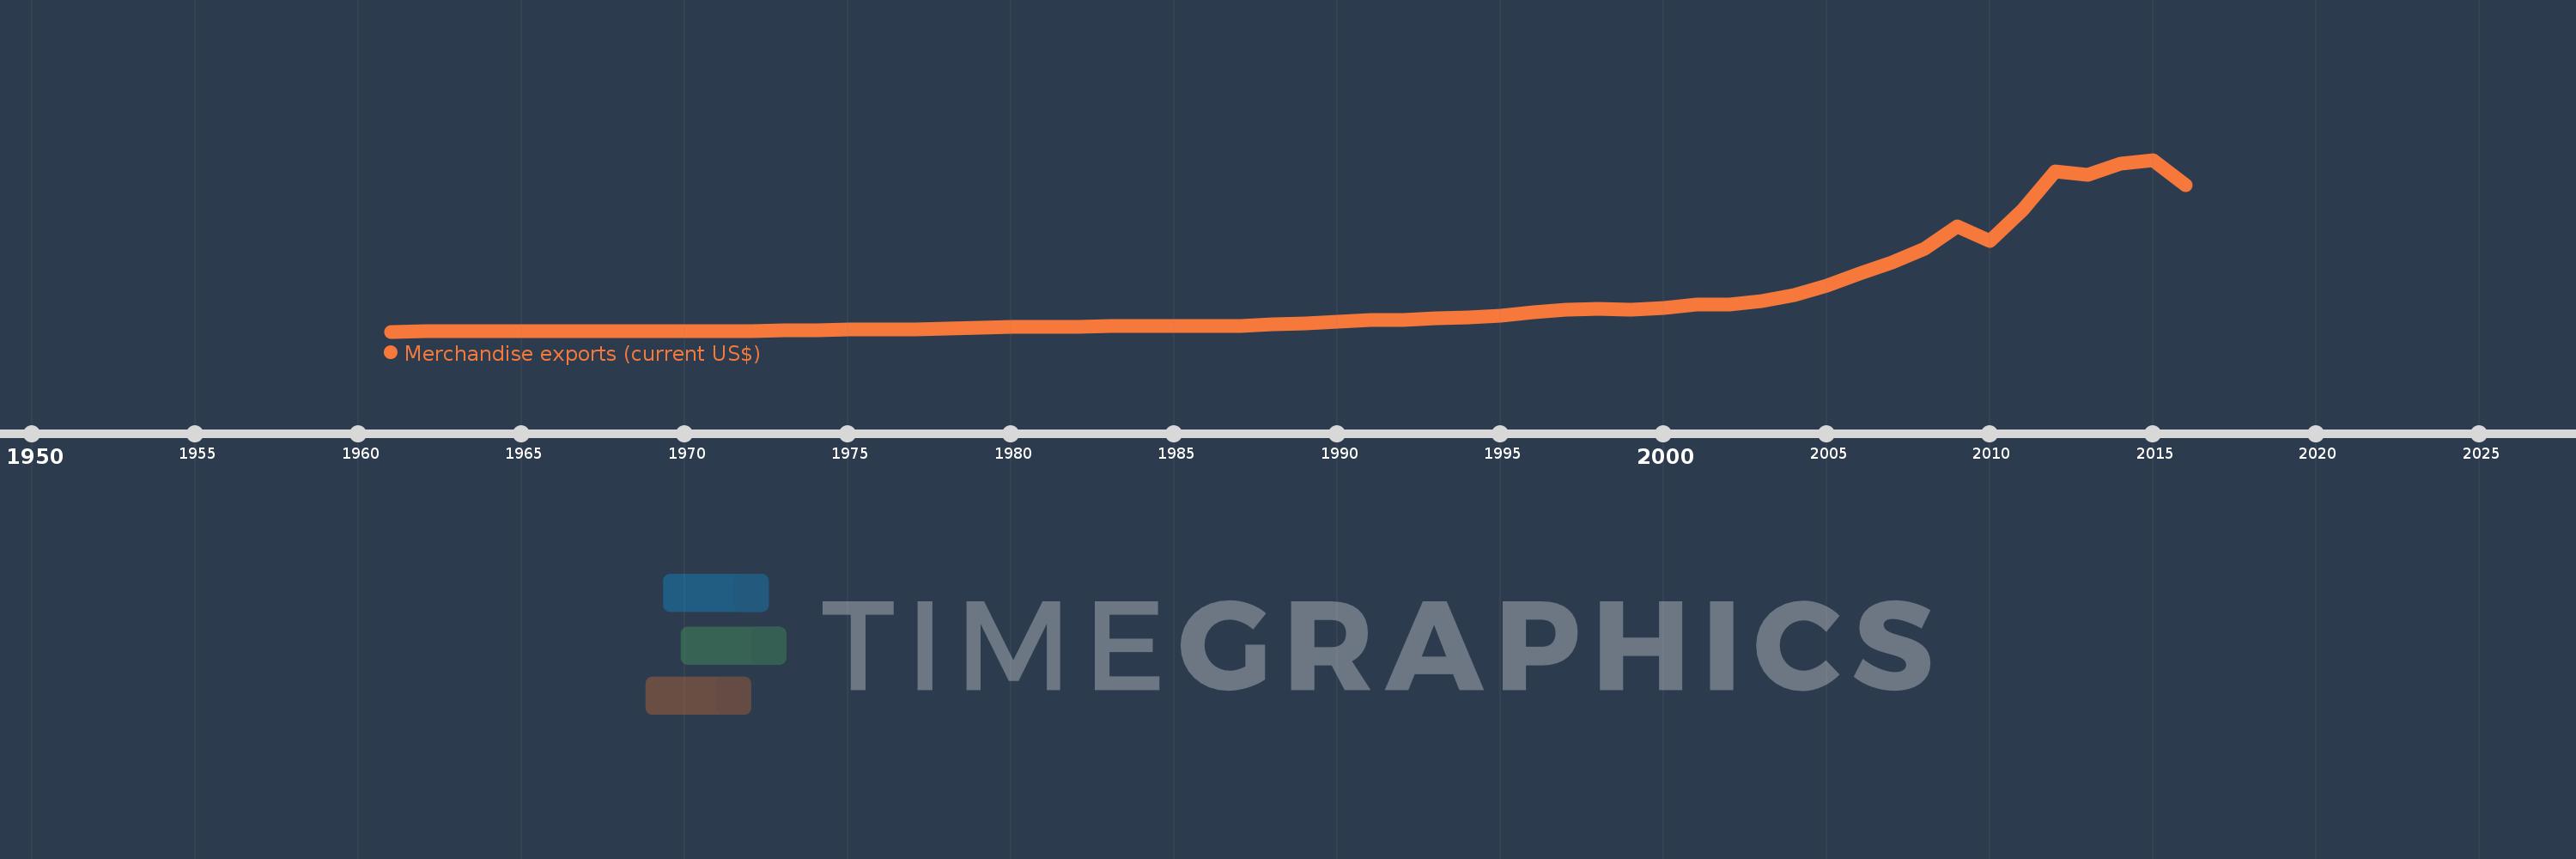
Merchandise exports (current US$)
2016,2015,2014,2013,2012,2011,2010,2009,2008,2007,2006,2005,2004,2003,2002,2001,2000,1999,1998,1997,1996,1995,1994,1993,1992,1991,1990,1989,1988,1987,1986,1985,1984,1983,1982,1981,1980,1979,1978,1977,1976,1975,1974,1973,1972,1971,1970,1969,1968,1967,1966,1965,1964,1963,1962,1961
This statistics in other country:
AfghanistanAlbaniaAlgeriaAmerican SamoaAngolaAntigua and BarbudaArab WorldArgentinaArmeniaArubaAustraliaAustriaAzerbaijanBahamas, TheBahrainBangladeshBarbadosBelarusBelgiumBelizeBeninBermudaBhutanBoliviaBosnia and HerzegovinaBotswanaBrazilBrunei DarussalamBulgariaBurkina FasoBurundiCabo VerdeCambodiaCameroonCanadaCaribbean small statesCentral African RepublicCentral Europe and the BalticsChadChileChinaColombiaComorosCongo, Dem. Rep.Congo, Rep.Costa RicaCote d'IvoireCroatiaCubaCuracaoCyprusCzech RepublicDenmarkDjiboutiDominicaDominican RepublicEarly-demographic dividendEast Asia & PacificEast Asia & Pacific (excluding high income)East Asia & Pacific (IDA & IBRD countries)EcuadorEgypt, Arab Rep.El SalvadorEquatorial GuineaEritreaEstoniaEthiopiaEuro areaEurope & Central AsiaEurope & Central Asia (excluding high income)Europe & Central Asia (IDA & IBRD countries)European UnionFaroe IslandsFijiFinlandFragile and conflict affected situationsFranceFrench PolynesiaGabonGambia, TheGeorgiaGermanyGhanaGreeceGreenlandGrenadaGuamGuatemalaGuineaGuinea-BissauGuyanaHaitiHeavily indebted poor countries (HIPC)High incomeHondurasHong Kong SAR, ChinaHungaryIBRD onlyIcelandIDA & IBRD totalIDA blendIDA onlyIDA totalIndiaIndonesiaIran, Islamic Rep.IraqIrelandIsraelItalyJamaicaJapanJordanKazakhstanKenyaKiribatiKorea, Dem. People’s Rep.Korea, Rep.KuwaitKyrgyz RepublicLao PDRLate-demographic dividendLatin America & Caribbean Latin America & Caribbean (excluding high income)Latin America & the Caribbean (IDA & IBRD countries)LatviaLeast developed countries: UN classificationLebanonLesothoLiberiaLibyaLithuaniaLow & middle incomeLow incomeLower middle incomeLuxembourgMacao SAR, ChinaMacedonia, FYRMadagascarMalawiMalaysiaMaldivesMaliMaltaMarshall IslandsMauritaniaMauritiusMexicoMicronesia, Fed. Sts.Middle East & North AfricaMiddle East & North Africa (excluding high income)Middle East & North Africa (IDA & IBRD countries)Middle incomeMoldovaMongoliaMontenegroMoroccoMozambiqueMyanmarNamibiaNepalNetherlandsNew CaledoniaNew ZealandNicaraguaNigerNigeriaNorth AmericaNorthern Mariana IslandsNorwayOECD membersOmanOther small statesPacific island small statesPakistanPalauPanamaPapua New GuineaParaguayPeruPhilippinesPolandPortugalPost-demographic dividendPre-demographic dividendQatarRomaniaRussian FederationRwandaSamoaSao Tome and PrincipeSaudi ArabiaSenegalSerbiaSeychellesSierra LeoneSingaporeSint Maarten (Dutch part)Slovak RepublicSloveniaSmall statesSolomon IslandsSouth AfricaSouth AsiaSouth Asia (IDA & IBRD)SpainSri LankaSt. Kitts and NevisSt. LuciaSt. Martin (French part)St. Vincent and the GrenadinesSub-Saharan Africa Sub-Saharan Africa (excluding high income)Sub-Saharan Africa (IDA & IBRD countries)SudanSurinameSwazilandSwedenSwitzerlandSyrian Arab RepublicTajikistanTanzaniaThailandTimor-LesteTogoTongaTrinidad and TobagoTunisiaTurkeyTurkmenistanTuvaluUgandaUkraineUnited Arab EmiratesUnited KingdomUnited StatesUpper middle incomeUruguayUzbekistanVanuatuVenezuela, RBVietnamWorldYemen, Rep.ZambiaZimbabwe Timeline:
This timeline shows a graph from 1961 to 2016 of South Asia (IDA & IBRD). No data until 1960. Number of actual observations by date: 56.
Source name:
World Development Indicators
Source organization:
World Trade Organization.
Categories, topics:
Private Sector, Trade
Last updated:
apr 23, 2017
Indicators value changes by year
Minimum:
2.326 bln
jan 1, 1961
Maximum:
391.271 bln
jan 1, 2015
At the date of observation
Value
Absolute change
Change from previous value
jan 1, 1961
2.326 bln
+2.326 bln
0.0%
jan 1, 1962
2.395 bln
+69.047 mln
2.97%
jan 1, 1963
2.401 bln
+5.883 mln
0.25%
jan 1, 1964
2.666 bln
+265.807 mln
11.07%
jan 1, 1965
2.85 bln
+183.095 mln
6.87%
jan 1, 1966
2.958 bln
+108.978 mln
3.82%
jan 1, 1967
3.262 bln
+303.666 mln
10.26%
jan 1, 1968
2.936 bln
-325.793 mln
-9.99%
jan 1, 1969
2.68 bln
-256.657 mln
-8.74%
jan 1, 1970
2.796 bln
+116.767 mln
4.36%
jan 1, 1971
3.138 bln
+341.646 mln
12.22%
jan 1, 1972
3.218 bln
+79.734 mln
2.54%
jan 1, 1973
4.405 bln
+1.187 bln
36.88%
jan 1, 1974
4.96 bln
+555.714 mln
12.62%
jan 1, 1975
6.302 bln
+1.342 bln
27.05%
jan 1, 1976
6.632 bln
+329.967 mln
5.24%
jan 1, 1977
8.11 bln
+1.478 bln
22.28%
jan 1, 1978
9.229 bln
+1.119 bln
13.79%
jan 1, 1979
10.127 bln
+898.015 mln
9.73%
jan 1, 1980
12.51 bln
+2.384 bln
23.54%
jan 1, 1981
13.805 bln
+1.295 bln
10.35%
jan 1, 1982
13.926 bln
+121.0 mln
0.88%
jan 1, 1983
14.377 bln
+451.0 mln
3.24%
jan 1, 1984
14.867 bln
+490.0 mln
3.41%
jan 1, 1985
15.653 bln
+786.0 mln
5.29%
jan 1, 1986
14.944 bln
-709.0 mln
-4.53%
jan 1, 1987
15.631 bln
+687.0 mln
4.6%
jan 1, 1988
18.654 bln
+3.023 bln
19.34%
jan 1, 1989
21.317 bln
+2.663 bln
14.28%
jan 1, 1990
23.914 bln
+2.597 bln
12.18%
jan 1, 1991
27.754 bln
+3.84 bln
16.06%
jan 1, 1992
28.547 bln
+793.1 mln
2.86%
jan 1, 1993
32.213 bln
+3.666 bln
12.84%
jan 1, 1994
34.886 bln
+2.673 bln
8.3%
jan 1, 1995
39.172 bln
+4.287 bln
12.29%
jan 1, 1996
46.657 bln
+7.485 bln
19.11%
jan 1, 1997
51.507 bln
+4.85 bln
10.4%
jan 1, 1998
53.995 bln
+2.488 bln
4.83%
jan 1, 1999
52.718 bln
-1.277 bln
-2.37%
jan 1, 2000
55.158 bln
+2.44 bln
4.63%
jan 1, 2001
64.379 bln
+9.221 bln
16.72%
jan 1, 2002
64.516 bln
+137.0 mln
0.21%
jan 1, 2003
70.924 bln
+6.408 bln
9.93%
jan 1, 2004
84.099 bln
+13.175 bln
18.58%
jan 1, 2005
105.53 bln
+21.431 bln
25.48%
jan 1, 2006
132.978 bln
+27.448 bln
26.01%
jan 1, 2007
159.319 bln
+26.341 bln
19.81%
jan 1, 2008
190.414 bln
+31.095 bln
19.52%
jan 1, 2009
241.305 bln
+50.89 bln
26.73%
jan 1, 2010
206.751 bln
-34.554 bln
-14.32%
jan 1, 2011
277.64 bln
+70.89 bln
34.29%
jan 1, 2012
365.279 bln
+87.639 bln
31.57%
jan 1, 2013
358.092 bln
-7.187 bln
-1.97%
jan 1, 2014
381.559 bln
+23.467 bln
6.55%
jan 1, 2015
391.271 bln
+9.713 bln
2.55%
jan 1, 2016
334.199 bln
-57.073 bln
-14.59%
Ranking of countries by current statistics by years


Comments: