29
/
en
AIzaSyAYiBZKx7MnpbEhh9jyipgxe19OcubqV5w
April 1, 2024
205527
Namibia
NAM
true
2
1
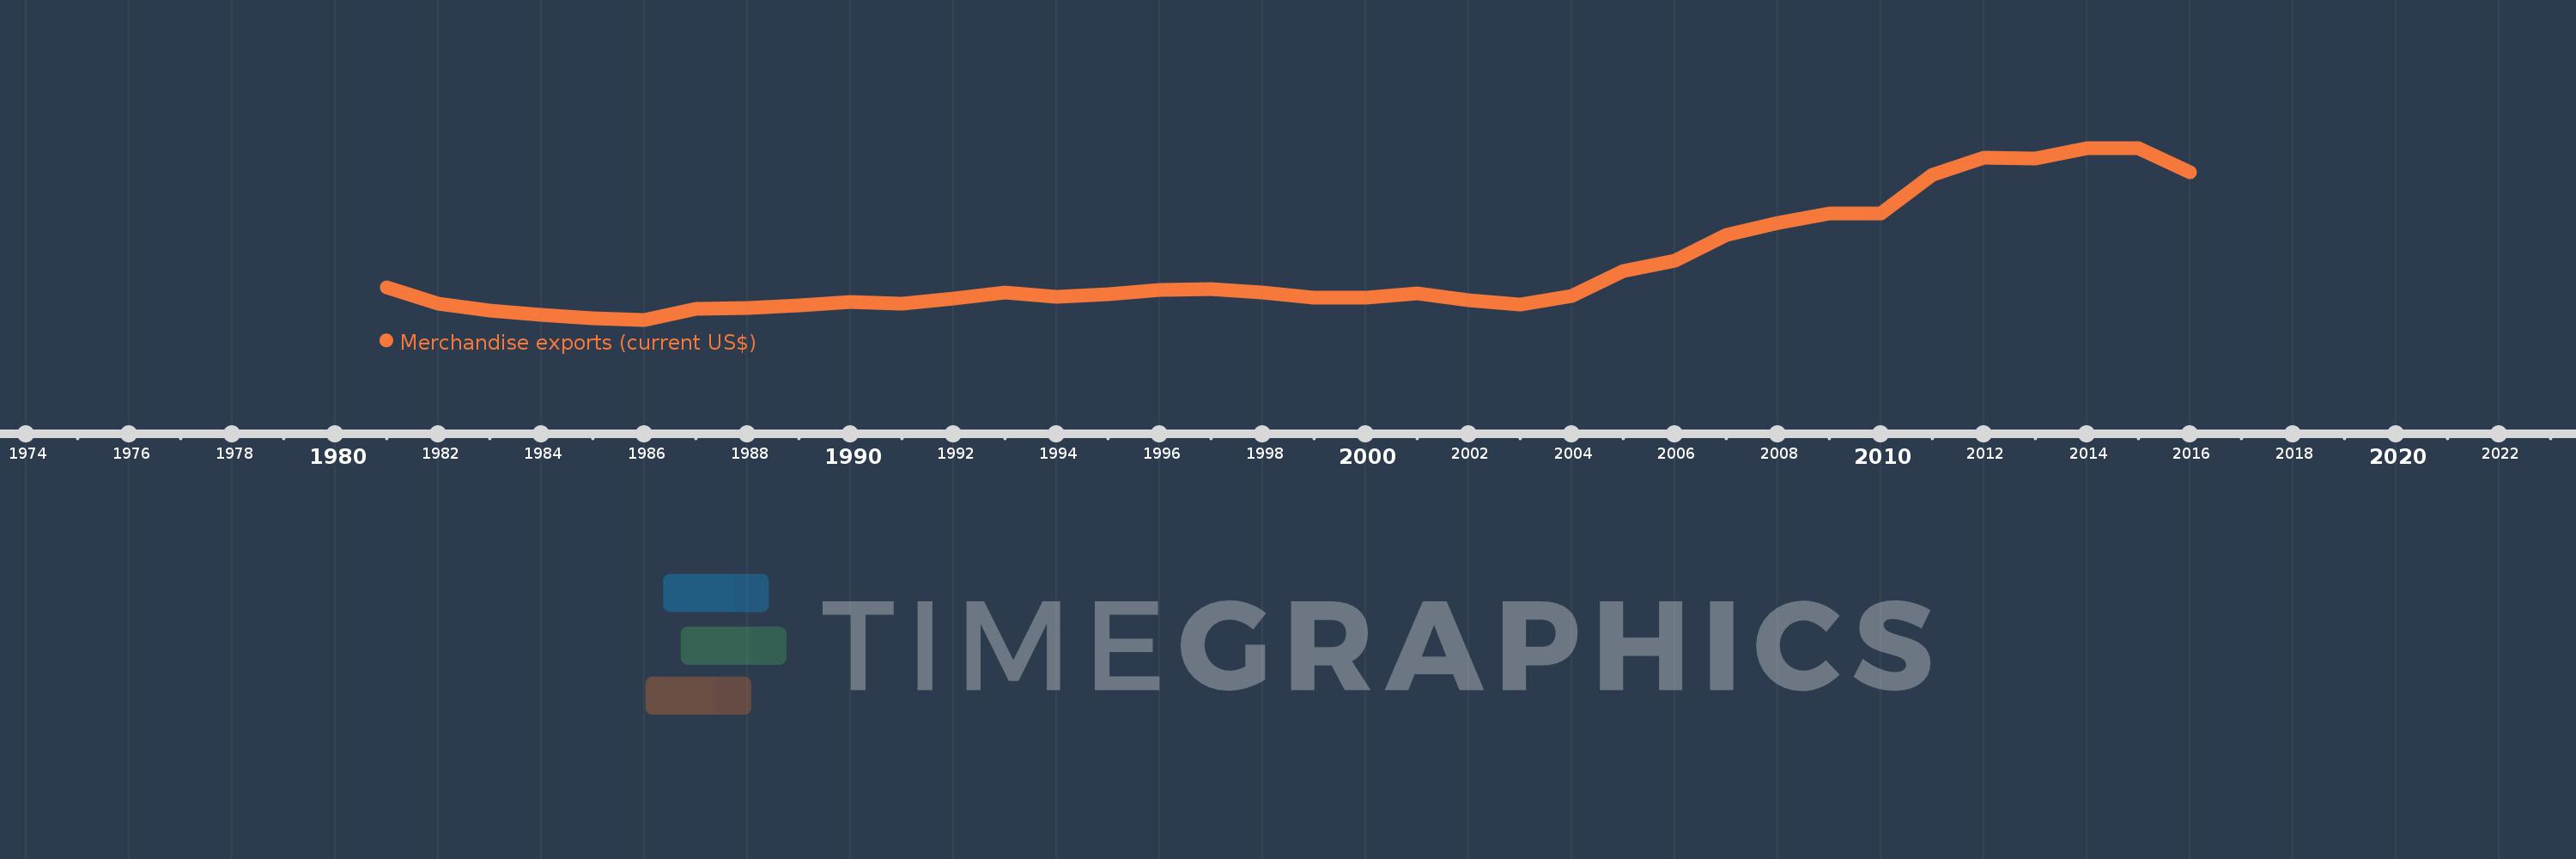
Merchandise exports (current US$)
2016,2015,2014,2013,2012,2011,2010,2009,2008,2007,2006,2005,2004,2003,2002,2001,2000,1999,1998,1997,1996,1995,1994,1993,1992,1991,1990,1989,1988,1987,1986,1985,1984,1983,1982,1981
This statistics in other country:
AfghanistanAlbaniaAlgeriaAmerican SamoaAngolaAntigua and BarbudaArab WorldArgentinaArmeniaArubaAustraliaAustriaAzerbaijanBahamas, TheBahrainBangladeshBarbadosBelarusBelgiumBelizeBeninBermudaBhutanBoliviaBosnia and HerzegovinaBotswanaBrazilBrunei DarussalamBulgariaBurkina FasoBurundiCabo VerdeCambodiaCameroonCanadaCaribbean small statesCentral African RepublicCentral Europe and the BalticsChadChileChinaColombiaComorosCongo, Dem. Rep.Congo, Rep.Costa RicaCote d'IvoireCroatiaCubaCuracaoCyprusCzech RepublicDenmarkDjiboutiDominicaDominican RepublicEarly-demographic dividendEast Asia & PacificEast Asia & Pacific (excluding high income)East Asia & Pacific (IDA & IBRD countries)EcuadorEgypt, Arab Rep.El SalvadorEquatorial GuineaEritreaEstoniaEthiopiaEuro areaEurope & Central AsiaEurope & Central Asia (excluding high income)Europe & Central Asia (IDA & IBRD countries)European UnionFaroe IslandsFijiFinlandFragile and conflict affected situationsFranceFrench PolynesiaGabonGambia, TheGeorgiaGermanyGhanaGreeceGreenlandGrenadaGuamGuatemalaGuineaGuinea-BissauGuyanaHaitiHeavily indebted poor countries (HIPC)High incomeHondurasHong Kong SAR, ChinaHungaryIBRD onlyIcelandIDA & IBRD totalIDA blendIDA onlyIDA totalIndiaIndonesiaIran, Islamic Rep.IraqIrelandIsraelItalyJamaicaJapanJordanKazakhstanKenyaKiribatiKorea, Dem. People’s Rep.Korea, Rep.KuwaitKyrgyz RepublicLao PDRLate-demographic dividendLatin America & Caribbean Latin America & Caribbean (excluding high income)Latin America & the Caribbean (IDA & IBRD countries)LatviaLeast developed countries: UN classificationLebanonLesothoLiberiaLibyaLithuaniaLow & middle incomeLow incomeLower middle incomeLuxembourgMacao SAR, ChinaMacedonia, FYRMadagascarMalawiMalaysiaMaldivesMaliMaltaMarshall IslandsMauritaniaMauritiusMexicoMicronesia, Fed. Sts.Middle East & North AfricaMiddle East & North Africa (excluding high income)Middle East & North Africa (IDA & IBRD countries)Middle incomeMoldovaMongoliaMontenegroMoroccoMozambiqueMyanmarNamibiaNepalNetherlandsNew CaledoniaNew ZealandNicaraguaNigerNigeriaNorth AmericaNorthern Mariana IslandsNorwayOECD membersOmanOther small statesPacific island small statesPakistanPalauPanamaPapua New GuineaParaguayPeruPhilippinesPolandPortugalPost-demographic dividendPre-demographic dividendQatarRomaniaRussian FederationRwandaSamoaSao Tome and PrincipeSaudi ArabiaSenegalSerbiaSeychellesSierra LeoneSingaporeSint Maarten (Dutch part)Slovak RepublicSloveniaSmall statesSolomon IslandsSouth AfricaSouth AsiaSouth Asia (IDA & IBRD)SpainSri LankaSt. Kitts and NevisSt. LuciaSt. Martin (French part)St. Vincent and the GrenadinesSub-Saharan Africa Sub-Saharan Africa (excluding high income)Sub-Saharan Africa (IDA & IBRD countries)SudanSurinameSwazilandSwedenSwitzerlandSyrian Arab RepublicTajikistanTanzaniaThailandTimor-LesteTogoTongaTrinidad and TobagoTunisiaTurkeyTurkmenistanTuvaluUgandaUkraineUnited Arab EmiratesUnited KingdomUnited StatesUpper middle incomeUruguayUzbekistanVanuatuVenezuela, RBVietnamWorldYemen, Rep.ZambiaZimbabwe Timeline:
This timeline shows a graph from 1981 to 2016 of Namibia. No data until 1980. Number of actual observations by date: 36.
Source name:
World Development Indicators
Source organization:
World Trade Organization.
Categories, topics:
Private Sector, Trade
Last updated:
apr 23, 2017
Indicators value changes by year
Minimum:
727.0 mln
jan 1, 1986
Maximum:
4.629 bln
jan 1, 2014
At the date of observation
Value
Absolute change
Change from previous value
jan 1, 1981
1.459 bln
+1.459 bln
0.0%
jan 1, 1982
1.088 bln
-371.0 mln
-25.43%
jan 1, 1983
934.0 mln
-154.0 mln
-14.15%
jan 1, 1984
846.0 mln
-88.0 mln
-9.42%
jan 1, 1985
766.0 mln
-80.0 mln
-9.46%
jan 1, 1986
727.0 mln
-39.0 mln
-5.09%
jan 1, 1987
977.0 mln
+250.0 mln
34.39%
jan 1, 1988
993.0 mln
+16.0 mln
1.64%
jan 1, 1989
1.055 bln
+62.0 mln
6.24%
jan 1, 1990
1.122 bln
+67.0 mln
6.35%
jan 1, 1991
1.085 bln
-37.0 mln
-3.3%
jan 1, 1992
1.213 bln
+128.0 mln
11.8%
jan 1, 1993
1.341 bln
+128.0 mln
10.55%
jan 1, 1994
1.24 bln
-101.0 mln
-7.53%
jan 1, 1995
1.308 bln
+68.0 mln
5.48%
jan 1, 1996
1.409 bln
+101.0 mln
7.72%
jan 1, 1997
1.418 bln
+9.0 mln
0.64%
jan 1, 1998
1.338 bln
-80.0 mln
-5.64%
jan 1, 1999
1.232 bln
-106.0 mln
-7.92%
jan 1, 2000
1.234 bln
+2.0 mln
0.16%
jan 1, 2001
1.32 bln
+86.0 mln
6.97%
jan 1, 2002
1.179 bln
-141.0 mln
-10.68%
jan 1, 2003
1.072 bln
-107.4 mln
-9.11%
jan 1, 2004
1.262 bln
+190.4 mln
17.77%
jan 1, 2005
1.827 bln
+565.0 mln
44.77%
jan 1, 2006
2.07 bln
+243.0 mln
13.3%
jan 1, 2007
2.647 bln
+576.66 mln
27.86%
jan 1, 2008
2.922 bln
+274.96 mln
10.39%
jan 1, 2009
3.141 bln
+218.905 mln
7.49%
jan 1, 2010
3.146 bln
+5.789 mln
0.18%
jan 1, 2011
4.026 bln
+879.204 mln
27.94%
jan 1, 2012
4.407 bln
+381.187 mln
9.47%
jan 1, 2013
4.389 bln
-17.896 mln
-0.41%
jan 1, 2014
4.629 bln
+240.108 mln
5.47%
jan 1, 2015
4.62 bln
-8.896 mln
-0.19%
jan 1, 2016
4.082 bln
-538.191 mln
-11.65%
Ranking of countries by current statistics by years


Comments: