29
/
en
AIzaSyAYiBZKx7MnpbEhh9jyipgxe19OcubqV5w
April 1, 2024
215516
Oman
OMN
true
2
1
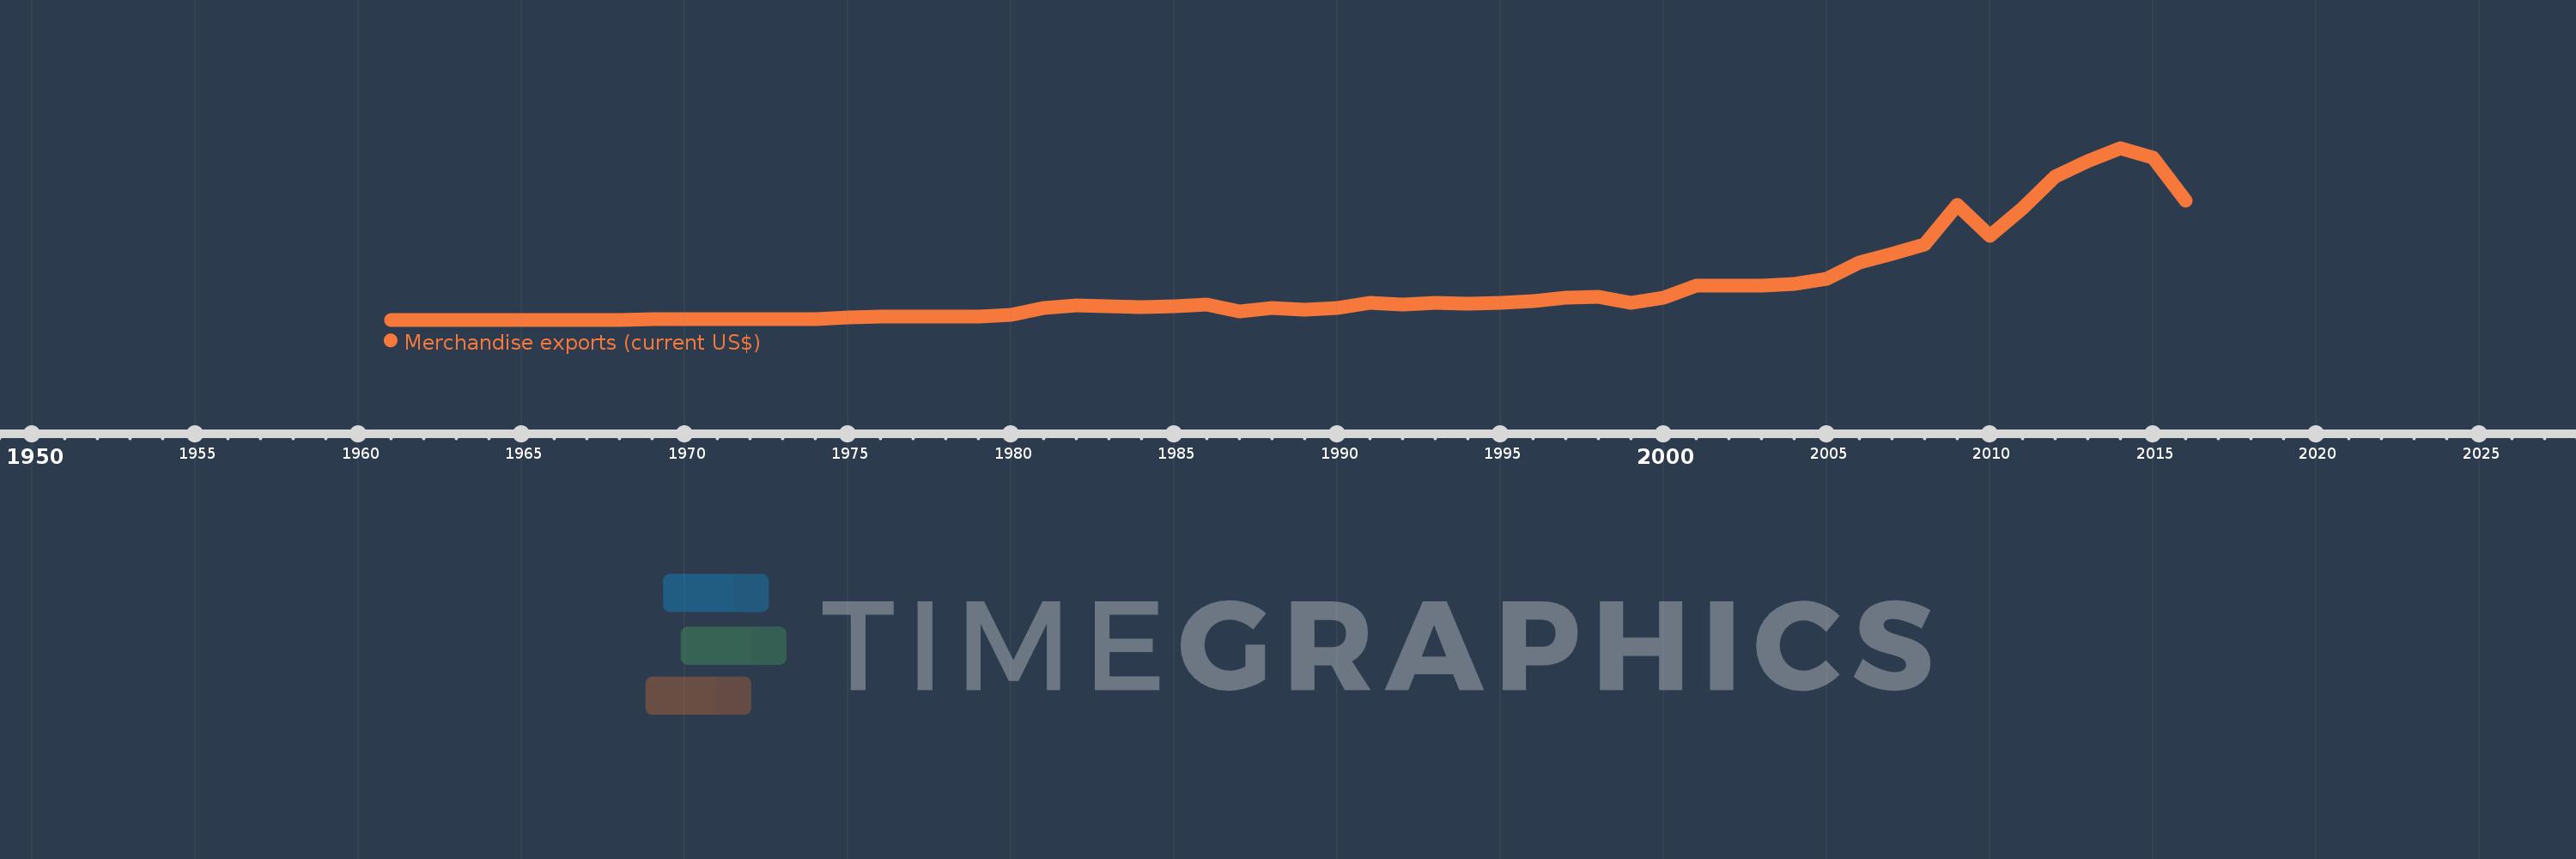
Merchandise exports (current US$)
2016,2015,2014,2013,2012,2011,2010,2009,2008,2007,2006,2005,2004,2003,2002,2001,2000,1999,1998,1997,1996,1995,1994,1993,1992,1991,1990,1989,1988,1987,1986,1985,1984,1983,1982,1981,1980,1979,1978,1977,1976,1975,1974,1973,1972,1971,1970,1969,1968,1967,1966,1965,1964,1963,1962,1961
This statistics in other country:
AfghanistanAlbaniaAlgeriaAmerican SamoaAngolaAntigua and BarbudaArab WorldArgentinaArmeniaArubaAustraliaAustriaAzerbaijanBahamas, TheBahrainBangladeshBarbadosBelarusBelgiumBelizeBeninBermudaBhutanBoliviaBosnia and HerzegovinaBotswanaBrazilBrunei DarussalamBulgariaBurkina FasoBurundiCabo VerdeCambodiaCameroonCanadaCaribbean small statesCentral African RepublicCentral Europe and the BalticsChadChileChinaColombiaComorosCongo, Dem. Rep.Congo, Rep.Costa RicaCote d'IvoireCroatiaCubaCuracaoCyprusCzech RepublicDenmarkDjiboutiDominicaDominican RepublicEarly-demographic dividendEast Asia & PacificEast Asia & Pacific (excluding high income)East Asia & Pacific (IDA & IBRD countries)EcuadorEgypt, Arab Rep.El SalvadorEquatorial GuineaEritreaEstoniaEthiopiaEuro areaEurope & Central AsiaEurope & Central Asia (excluding high income)Europe & Central Asia (IDA & IBRD countries)European UnionFaroe IslandsFijiFinlandFragile and conflict affected situationsFranceFrench PolynesiaGabonGambia, TheGeorgiaGermanyGhanaGreeceGreenlandGrenadaGuamGuatemalaGuineaGuinea-BissauGuyanaHaitiHeavily indebted poor countries (HIPC)High incomeHondurasHong Kong SAR, ChinaHungaryIBRD onlyIcelandIDA & IBRD totalIDA blendIDA onlyIDA totalIndiaIndonesiaIran, Islamic Rep.IraqIrelandIsraelItalyJamaicaJapanJordanKazakhstanKenyaKiribatiKorea, Dem. People’s Rep.Korea, Rep.KuwaitKyrgyz RepublicLao PDRLate-demographic dividendLatin America & Caribbean Latin America & Caribbean (excluding high income)Latin America & the Caribbean (IDA & IBRD countries)LatviaLeast developed countries: UN classificationLebanonLesothoLiberiaLibyaLithuaniaLow & middle incomeLow incomeLower middle incomeLuxembourgMacao SAR, ChinaMacedonia, FYRMadagascarMalawiMalaysiaMaldivesMaliMaltaMarshall IslandsMauritaniaMauritiusMexicoMicronesia, Fed. Sts.Middle East & North AfricaMiddle East & North Africa (excluding high income)Middle East & North Africa (IDA & IBRD countries)Middle incomeMoldovaMongoliaMontenegroMoroccoMozambiqueMyanmarNamibiaNepalNetherlandsNew CaledoniaNew ZealandNicaraguaNigerNigeriaNorth AmericaNorthern Mariana IslandsNorwayOECD membersOmanOther small statesPacific island small statesPakistanPalauPanamaPapua New GuineaParaguayPeruPhilippinesPolandPortugalPost-demographic dividendPre-demographic dividendQatarRomaniaRussian FederationRwandaSamoaSao Tome and PrincipeSaudi ArabiaSenegalSerbiaSeychellesSierra LeoneSingaporeSint Maarten (Dutch part)Slovak RepublicSloveniaSmall statesSolomon IslandsSouth AfricaSouth AsiaSouth Asia (IDA & IBRD)SpainSri LankaSt. Kitts and NevisSt. LuciaSt. Martin (French part)St. Vincent and the GrenadinesSub-Saharan Africa Sub-Saharan Africa (excluding high income)Sub-Saharan Africa (IDA & IBRD countries)SudanSurinameSwazilandSwedenSwitzerlandSyrian Arab RepublicTajikistanTanzaniaThailandTimor-LesteTogoTongaTrinidad and TobagoTunisiaTurkeyTurkmenistanTuvaluUgandaUkraineUnited Arab EmiratesUnited KingdomUnited StatesUpper middle incomeUruguayUzbekistanVanuatuVenezuela, RBVietnamWorldYemen, Rep.ZambiaZimbabwe Timeline:
This timeline shows a graph from 1961 to 2016 of Oman. No data until 1960. Number of actual observations by date: 56.
Source name:
World Development Indicators
Source organization:
World Trade Organization.
Categories, topics:
Private Sector, Trade
Last updated:
apr 23, 2017
Indicators value changes by year
Minimum:
1.68 mln
jan 1, 1967
Maximum:
56.429 bln
jan 1, 2014
At the date of observation
Value
Absolute change
Change from previous value
jan 1, 1961
2.0 mln
+2.0 mln
0.0%
jan 1, 1962
2.0 mln
0.0
0.0%
jan 1, 1963
2.0 mln
0.0
0.0%
jan 1, 1964
2.0 mln
0.0
0.0%
jan 1, 1965
2.8 mln
+800.0K
40.0%
jan 1, 1966
2.24 mln
-560.0K
-20.0%
jan 1, 1967
1.68 mln
-560.0K
-25.0%
jan 1, 1968
26.205 mln
+24.525 mln
1.46K%
jan 1, 1969
104.573 mln
+78.368 mln
299.05%
jan 1, 1970
141.009 mln
+36.436 mln
34.84%
jan 1, 1971
142.721 mln
+1.712 mln
1.21%
jan 1, 1972
153.572 mln
+10.851 mln
7.6%
jan 1, 1973
167.321 mln
+13.749 mln
8.95%
jan 1, 1974
238.555 mln
+71.234 mln
42.57%
jan 1, 1975
822.774 mln
+584.219 mln
244.9%
jan 1, 1976
1.044 bln
+221.256 mln
26.89%
jan 1, 1977
1.134 bln
+89.61 mln
8.58%
jan 1, 1978
1.139 bln
+5.19 mln
0.46%
jan 1, 1979
1.096 bln
-42.4 mln
-3.72%
jan 1, 1980
1.57 bln
+473.52 mln
43.19%
jan 1, 1981
3.748 bln
+2.178 bln
138.73%
jan 1, 1982
4.696 bln
+948.0 mln
25.29%
jan 1, 1983
4.421 bln
-275.0 mln
-5.86%
jan 1, 1984
4.248 bln
-173.0 mln
-3.91%
jan 1, 1985
4.422 bln
+174.0 mln
4.1%
jan 1, 1986
4.972 bln
+550.0 mln
12.44%
jan 1, 1987
2.842 bln
-2.13 bln
-42.84%
jan 1, 1988
3.776 bln
+934.0 mln
32.86%
jan 1, 1989
3.268 bln
-508.0 mln
-13.45%
jan 1, 1990
3.933 bln
+665.0 mln
20.35%
jan 1, 1991
5.508 bln
+1.575 bln
40.05%
jan 1, 1992
4.871 bln
-637.0 mln
-11.56%
jan 1, 1993
5.428 bln
+557.0 mln
11.44%
jan 1, 1994
5.299 bln
-129.0 mln
-2.38%
jan 1, 1995
5.545 bln
+246.0 mln
4.64%
jan 1, 1996
6.068 bln
+523.0 mln
9.43%
jan 1, 1997
7.346 bln
+1.278 bln
21.06%
jan 1, 1998
7.63 bln
+284.0 mln
3.87%
jan 1, 1999
5.508 bln
-2.122 bln
-27.81%
jan 1, 2000
7.238 bln
+1.73 bln
31.41%
jan 1, 2001
11.319 bln
+4.081 bln
56.38%
jan 1, 2002
11.074 bln
-245.0 mln
-2.16%
jan 1, 2003
11.172 bln
+97.7 mln
0.88%
jan 1, 2004
11.669 bln
+497.0 mln
4.45%
jan 1, 2005
13.341 bln
+1.673 bln
14.34%
jan 1, 2006
18.692 bln
+5.35 bln
40.1%
jan 1, 2007
21.585 bln
+2.893 bln
15.48%
jan 1, 2008
24.692 bln
+3.107 bln
14.39%
jan 1, 2009
37.719 bln
+13.027 bln
52.76%
jan 1, 2010
27.651 bln
-10.068 bln
-26.69%
jan 1, 2011
36.601 bln
+8.95 bln
32.37%
jan 1, 2012
47.092 bln
+10.491 bln
28.66%
jan 1, 2013
52.138 bln
+5.046 bln
10.72%
jan 1, 2014
56.429 bln
+4.291 bln
8.23%
jan 1, 2015
53.221 bln
-3.208 bln
-5.68%
jan 1, 2016
39.244 bln
-13.977 bln
-26.26%
Ranking of countries by current statistics by years


Comments: