29
/
en
AIzaSyAYiBZKx7MnpbEhh9jyipgxe19OcubqV5w
April 1, 2024
185453
Madagascar
MDG
true
2
1
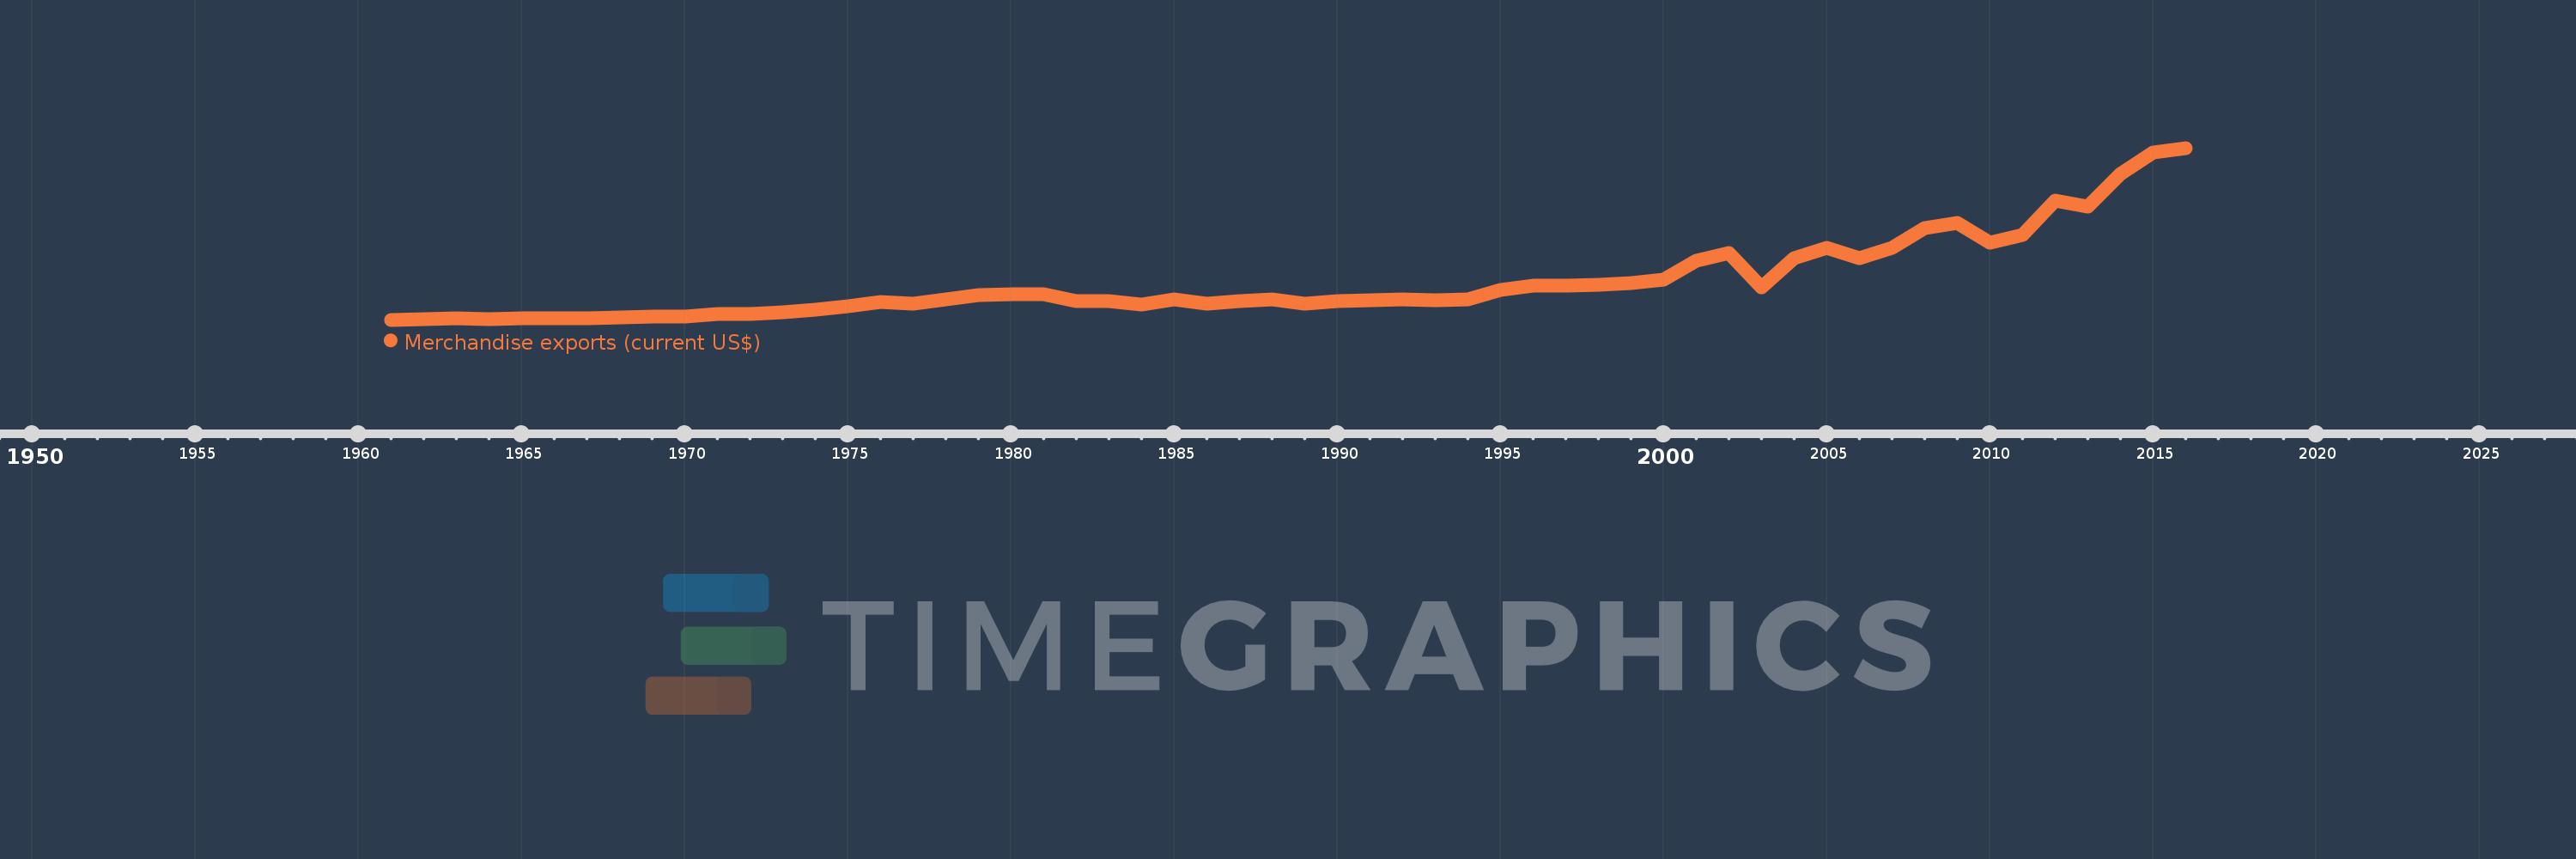
Merchandise exports (current US$)
2016,2015,2014,2013,2012,2011,2010,2009,2008,2007,2006,2005,2004,2003,2002,2001,2000,1999,1998,1997,1996,1995,1994,1993,1992,1991,1990,1989,1988,1987,1986,1985,1984,1983,1982,1981,1980,1979,1978,1977,1976,1975,1974,1973,1972,1971,1970,1969,1968,1967,1966,1965,1964,1963,1962,1961
This statistics in other country:
AfghanistanAlbaniaAlgeriaAmerican SamoaAngolaAntigua and BarbudaArab WorldArgentinaArmeniaArubaAustraliaAustriaAzerbaijanBahamas, TheBahrainBangladeshBarbadosBelarusBelgiumBelizeBeninBermudaBhutanBoliviaBosnia and HerzegovinaBotswanaBrazilBrunei DarussalamBulgariaBurkina FasoBurundiCabo VerdeCambodiaCameroonCanadaCaribbean small statesCentral African RepublicCentral Europe and the BalticsChadChileChinaColombiaComorosCongo, Dem. Rep.Congo, Rep.Costa RicaCote d'IvoireCroatiaCubaCuracaoCyprusCzech RepublicDenmarkDjiboutiDominicaDominican RepublicEarly-demographic dividendEast Asia & PacificEast Asia & Pacific (excluding high income)East Asia & Pacific (IDA & IBRD countries)EcuadorEgypt, Arab Rep.El SalvadorEquatorial GuineaEritreaEstoniaEthiopiaEuro areaEurope & Central AsiaEurope & Central Asia (excluding high income)Europe & Central Asia (IDA & IBRD countries)European UnionFaroe IslandsFijiFinlandFragile and conflict affected situationsFranceFrench PolynesiaGabonGambia, TheGeorgiaGermanyGhanaGreeceGreenlandGrenadaGuamGuatemalaGuineaGuinea-BissauGuyanaHaitiHeavily indebted poor countries (HIPC)High incomeHondurasHong Kong SAR, ChinaHungaryIBRD onlyIcelandIDA & IBRD totalIDA blendIDA onlyIDA totalIndiaIndonesiaIran, Islamic Rep.IraqIrelandIsraelItalyJamaicaJapanJordanKazakhstanKenyaKiribatiKorea, Dem. People’s Rep.Korea, Rep.KuwaitKyrgyz RepublicLao PDRLate-demographic dividendLatin America & Caribbean Latin America & Caribbean (excluding high income)Latin America & the Caribbean (IDA & IBRD countries)LatviaLeast developed countries: UN classificationLebanonLesothoLiberiaLibyaLithuaniaLow & middle incomeLow incomeLower middle incomeLuxembourgMacao SAR, ChinaMacedonia, FYRMadagascarMalawiMalaysiaMaldivesMaliMaltaMarshall IslandsMauritaniaMauritiusMexicoMicronesia, Fed. Sts.Middle East & North AfricaMiddle East & North Africa (excluding high income)Middle East & North Africa (IDA & IBRD countries)Middle incomeMoldovaMongoliaMontenegroMoroccoMozambiqueMyanmarNamibiaNepalNetherlandsNew CaledoniaNew ZealandNicaraguaNigerNigeriaNorth AmericaNorthern Mariana IslandsNorwayOECD membersOmanOther small statesPacific island small statesPakistanPalauPanamaPapua New GuineaParaguayPeruPhilippinesPolandPortugalPost-demographic dividendPre-demographic dividendQatarRomaniaRussian FederationRwandaSamoaSao Tome and PrincipeSaudi ArabiaSenegalSerbiaSeychellesSierra LeoneSingaporeSint Maarten (Dutch part)Slovak RepublicSloveniaSmall statesSolomon IslandsSouth AfricaSouth AsiaSouth Asia (IDA & IBRD)SpainSri LankaSt. Kitts and NevisSt. LuciaSt. Martin (French part)St. Vincent and the GrenadinesSub-Saharan Africa Sub-Saharan Africa (excluding high income)Sub-Saharan Africa (IDA & IBRD countries)SudanSurinameSwazilandSwedenSwitzerlandSyrian Arab RepublicTajikistanTanzaniaThailandTimor-LesteTogoTongaTrinidad and TobagoTunisiaTurkeyTurkmenistanTuvaluUgandaUkraineUnited Arab EmiratesUnited KingdomUnited StatesUpper middle incomeUruguayUzbekistanVanuatuVenezuela, RBVietnamWorldYemen, Rep.ZambiaZimbabwe Timeline:
This timeline shows a graph from 1961 to 2016 of Madagascar. No data until 1960. Number of actual observations by date: 56.
Source name:
World Development Indicators
Source organization:
World Trade Organization.
Categories, topics:
Private Sector, Trade
Last updated:
apr 23, 2017
Indicators value changes by year
Minimum:
74.883 mln
jan 1, 1961
Maximum:
2.258 bln
jan 1, 2016
At the date of observation
Value
Absolute change
Change from previous value
jan 1, 1961
74.883 mln
+74.883 mln
0.0%
jan 1, 1962
77.528 mln
+2.645 mln
3.53%
jan 1, 1963
94.331 mln
+16.803 mln
21.67%
jan 1, 1964
82.081 mln
-12.25 mln
-12.99%
jan 1, 1965
91.771 mln
+9.69 mln
11.81%
jan 1, 1966
91.682 mln
-89.1K
-0.1%
jan 1, 1967
97.759 mln
+6.077 mln
6.63%
jan 1, 1968
104.155 mln
+6.396 mln
6.54%
jan 1, 1969
115.891 mln
+11.736 mln
11.27%
jan 1, 1970
111.42 mln
-4.471 mln
-3.86%
jan 1, 1971
144.835 mln
+33.415 mln
29.99%
jan 1, 1972
147.471 mln
+2.636 mln
1.82%
jan 1, 1973
166.245 mln
+18.774 mln
12.73%
jan 1, 1974
202.718 mln
+36.473 mln
21.94%
jan 1, 1975
244.162 mln
+41.444 mln
20.44%
jan 1, 1976
301.119 mln
+56.957 mln
23.33%
jan 1, 1977
275.053 mln
-26.066 mln
-8.66%
jan 1, 1978
338.486 mln
+63.433 mln
23.06%
jan 1, 1979
387.738 mln
+49.252 mln
14.55%
jan 1, 1980
394.443 mln
+6.705 mln
1.73%
jan 1, 1981
401.0 mln
+6.557 mln
1.66%
jan 1, 1982
316.0 mln
-85.0 mln
-21.2%
jan 1, 1983
308.0 mln
-8.0 mln
-2.53%
jan 1, 1984
263.0 mln
-45.0 mln
-14.61%
jan 1, 1985
334.0 mln
+71.0 mln
27.0%
jan 1, 1986
274.0 mln
-60.0 mln
-17.96%
jan 1, 1987
315.0 mln
+41.0 mln
14.96%
jan 1, 1988
331.0 mln
+16.0 mln
5.08%
jan 1, 1989
274.0 mln
-57.0 mln
-17.22%
jan 1, 1990
316.0 mln
+42.0 mln
15.33%
jan 1, 1991
319.0 mln
+3.0 mln
0.95%
jan 1, 1992
335.0 mln
+16.0 mln
5.02%
jan 1, 1993
327.0 mln
-8.0 mln
-2.39%
jan 1, 1994
335.0 mln
+8.0 mln
2.45%
jan 1, 1995
450.0 mln
+115.0 mln
34.33%
jan 1, 1996
507.0 mln
+57.0 mln
12.67%
jan 1, 1997
509.0 mln
+2.0 mln
0.39%
jan 1, 1998
516.0 mln
+7.0 mln
1.38%
jan 1, 1999
538.0 mln
+22.0 mln
4.26%
jan 1, 2000
584.0 mln
+46.0 mln
8.55%
jan 1, 2001
824.0 mln
+240.0 mln
41.1%
jan 1, 2002
928.0 mln
+104.0 mln
12.62%
jan 1, 2003
486.0 mln
-442.0 mln
-47.63%
jan 1, 2004
856.0 mln
+370.0 mln
76.13%
jan 1, 2005
991.613 mln
+135.613 mln
15.84%
jan 1, 2006
854.641 mln
-136.972 mln
-13.81%
jan 1, 2007
985.256 mln
+130.615 mln
15.28%
jan 1, 2008
1.238 bln
+252.428 mln
25.62%
jan 1, 2009
1.31 bln
+72.061 mln
5.82%
jan 1, 2010
1.052 bln
-257.758 mln
-19.68%
jan 1, 2011
1.149 bln
+97.483 mln
9.27%
jan 1, 2012
1.59 bln
+440.53 mln
38.32%
jan 1, 2013
1.516 bln
-74.089 mln
-4.66%
jan 1, 2014
1.923 bln
+406.696 mln
26.83%
jan 1, 2015
2.196 bln
+273.489 mln
14.22%
jan 1, 2016
2.258 bln
+61.518 mln
2.8%
Ranking of countries by current statistics by years


Comments: