29
/
en
AIzaSyAYiBZKx7MnpbEhh9jyipgxe19OcubqV5w
April 1, 2024
255429
Swaziland
SWZ
true
2
1
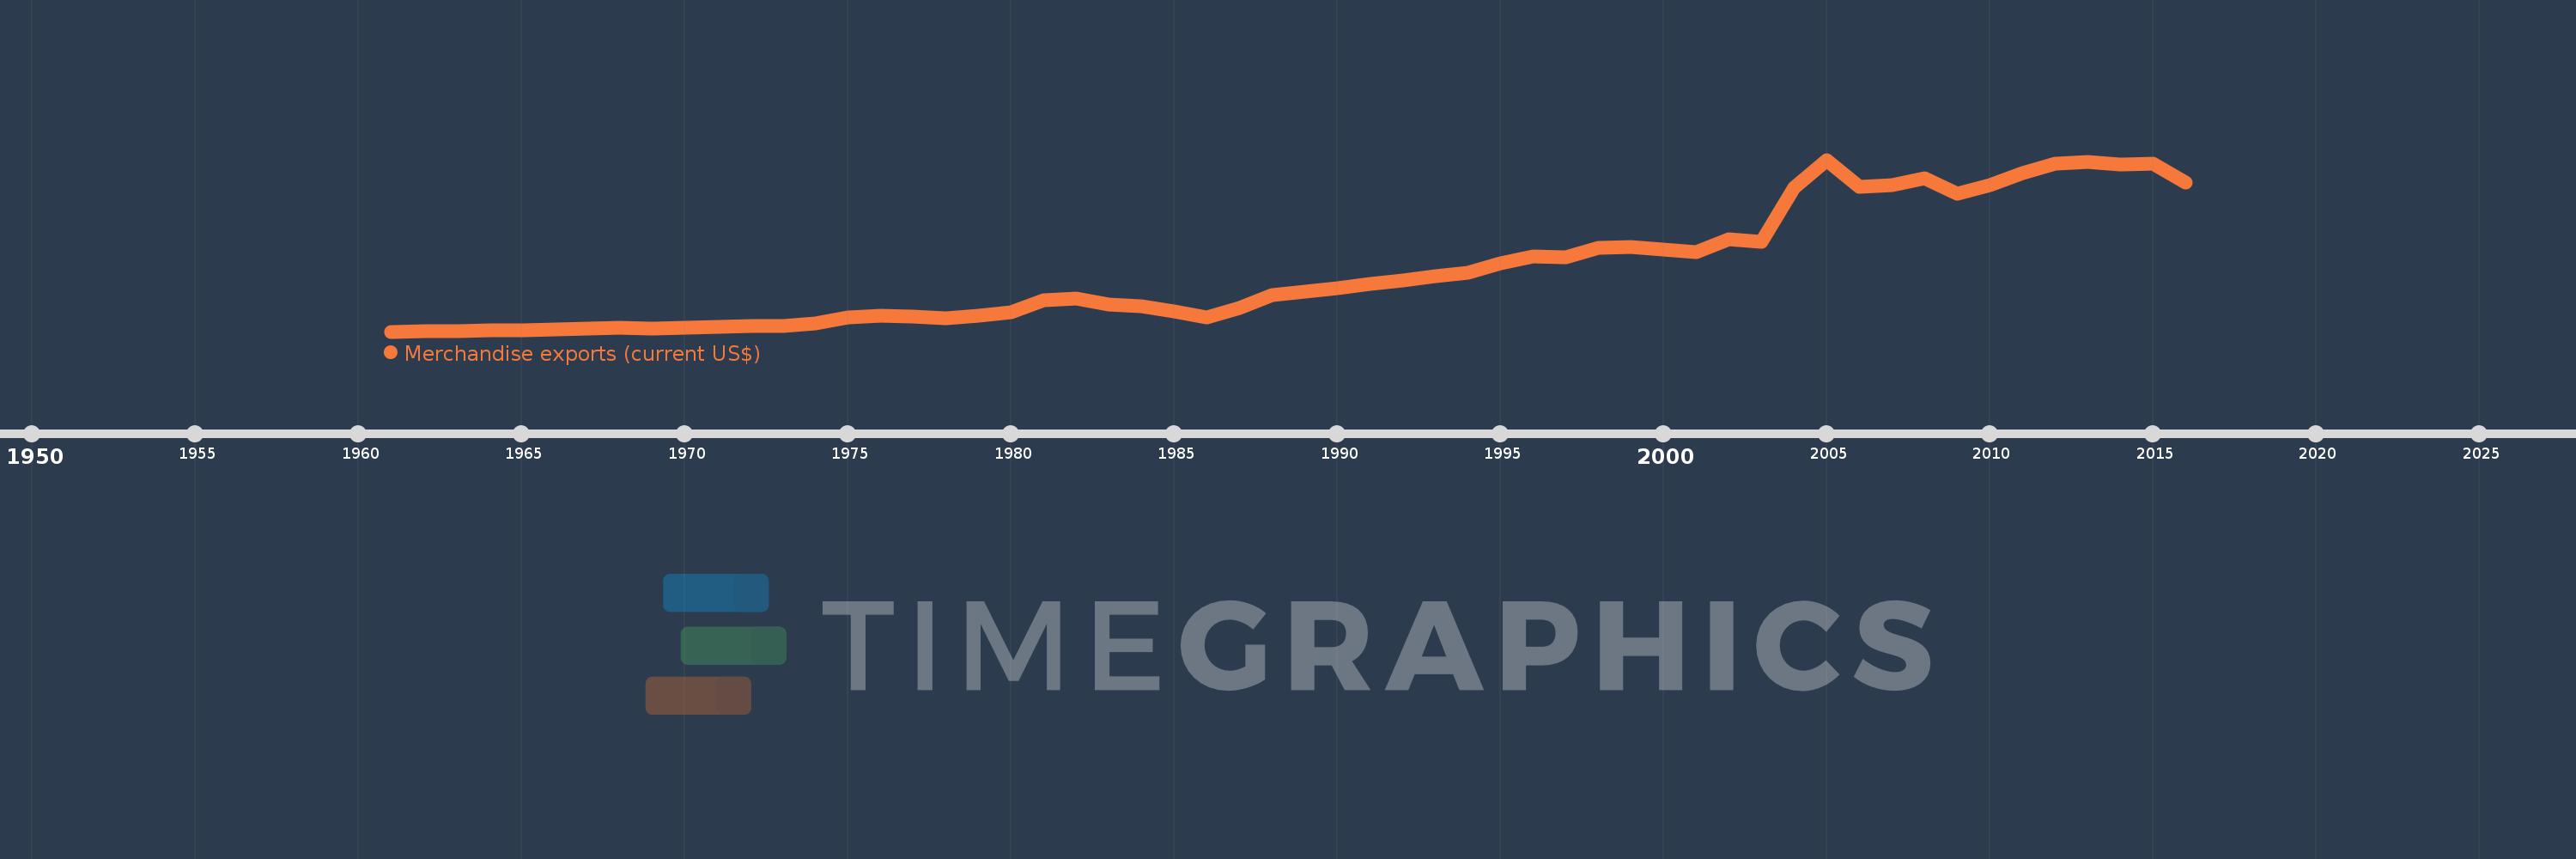
Merchandise exports (current US$)
2016,2015,2014,2013,2012,2011,2010,2009,2008,2007,2006,2005,2004,2003,2002,2001,2000,1999,1998,1997,1996,1995,1994,1993,1992,1991,1990,1989,1988,1987,1986,1985,1984,1983,1982,1981,1980,1979,1978,1977,1976,1975,1974,1973,1972,1971,1970,1969,1968,1967,1966,1965,1964,1963,1962,1961
This statistics in other country:
AfghanistanAlbaniaAlgeriaAmerican SamoaAngolaAntigua and BarbudaArab WorldArgentinaArmeniaArubaAustraliaAustriaAzerbaijanBahamas, TheBahrainBangladeshBarbadosBelarusBelgiumBelizeBeninBermudaBhutanBoliviaBosnia and HerzegovinaBotswanaBrazilBrunei DarussalamBulgariaBurkina FasoBurundiCabo VerdeCambodiaCameroonCanadaCaribbean small statesCentral African RepublicCentral Europe and the BalticsChadChileChinaColombiaComorosCongo, Dem. Rep.Congo, Rep.Costa RicaCote d'IvoireCroatiaCubaCuracaoCyprusCzech RepublicDenmarkDjiboutiDominicaDominican RepublicEarly-demographic dividendEast Asia & PacificEast Asia & Pacific (excluding high income)East Asia & Pacific (IDA & IBRD countries)EcuadorEgypt, Arab Rep.El SalvadorEquatorial GuineaEritreaEstoniaEthiopiaEuro areaEurope & Central AsiaEurope & Central Asia (excluding high income)Europe & Central Asia (IDA & IBRD countries)European UnionFaroe IslandsFijiFinlandFragile and conflict affected situationsFranceFrench PolynesiaGabonGambia, TheGeorgiaGermanyGhanaGreeceGreenlandGrenadaGuamGuatemalaGuineaGuinea-BissauGuyanaHaitiHeavily indebted poor countries (HIPC)High incomeHondurasHong Kong SAR, ChinaHungaryIBRD onlyIcelandIDA & IBRD totalIDA blendIDA onlyIDA totalIndiaIndonesiaIran, Islamic Rep.IraqIrelandIsraelItalyJamaicaJapanJordanKazakhstanKenyaKiribatiKorea, Dem. People’s Rep.Korea, Rep.KuwaitKyrgyz RepublicLao PDRLate-demographic dividendLatin America & Caribbean Latin America & Caribbean (excluding high income)Latin America & the Caribbean (IDA & IBRD countries)LatviaLeast developed countries: UN classificationLebanonLesothoLiberiaLibyaLithuaniaLow & middle incomeLow incomeLower middle incomeLuxembourgMacao SAR, ChinaMacedonia, FYRMadagascarMalawiMalaysiaMaldivesMaliMaltaMarshall IslandsMauritaniaMauritiusMexicoMicronesia, Fed. Sts.Middle East & North AfricaMiddle East & North Africa (excluding high income)Middle East & North Africa (IDA & IBRD countries)Middle incomeMoldovaMongoliaMontenegroMoroccoMozambiqueMyanmarNamibiaNepalNetherlandsNew CaledoniaNew ZealandNicaraguaNigerNigeriaNorth AmericaNorthern Mariana IslandsNorwayOECD membersOmanOther small statesPacific island small statesPakistanPalauPanamaPapua New GuineaParaguayPeruPhilippinesPolandPortugalPost-demographic dividendPre-demographic dividendQatarRomaniaRussian FederationRwandaSamoaSao Tome and PrincipeSaudi ArabiaSenegalSerbiaSeychellesSierra LeoneSingaporeSint Maarten (Dutch part)Slovak RepublicSloveniaSmall statesSolomon IslandsSouth AfricaSouth AsiaSouth Asia (IDA & IBRD)SpainSri LankaSt. Kitts and NevisSt. LuciaSt. Martin (French part)St. Vincent and the GrenadinesSub-Saharan Africa Sub-Saharan Africa (excluding high income)Sub-Saharan Africa (IDA & IBRD countries)SudanSurinameSwazilandSwedenSwitzerlandSyrian Arab RepublicTajikistanTanzaniaThailandTimor-LesteTogoTongaTrinidad and TobagoTunisiaTurkeyTurkmenistanTuvaluUgandaUkraineUnited Arab EmiratesUnited KingdomUnited StatesUpper middle incomeUruguayUzbekistanVanuatuVenezuela, RBVietnamWorldYemen, Rep.ZambiaZimbabwe Timeline:
This timeline shows a graph from 1961 to 2016 of Swaziland. No data until 1960. Number of actual observations by date: 56.
Source name:
World Development Indicators
Source organization:
World Trade Organization.
Categories, topics:
Private Sector, Trade
Last updated:
apr 23, 2017
Indicators value changes by year
Minimum:
16.87 mln
jan 1, 1961
Maximum:
1.949 bln
jan 1, 2005
At the date of observation
Value
Absolute change
Change from previous value
jan 1, 1961
16.87 mln
+16.87 mln
0.0%
jan 1, 1962
17.738 mln
+868.0K
5.15%
jan 1, 1963
21.322 mln
+3.584 mln
20.21%
jan 1, 1964
30.954 mln
+9.632 mln
45.17%
jan 1, 1965
31.766 mln
+812.0K
2.62%
jan 1, 1966
43.064 mln
+11.298 mln
35.57%
jan 1, 1967
53.69 mln
+10.626 mln
24.67%
jan 1, 1968
56.322 mln
+2.632 mln
4.9%
jan 1, 1969
55.09 mln
-1.232 mln
-2.19%
jan 1, 1970
62.328 mln
+7.238 mln
13.14%
jan 1, 1971
71.246 mln
+8.918 mln
14.31%
jan 1, 1972
77.924 mln
+6.678 mln
9.37%
jan 1, 1973
81.573 mln
+3.649 mln
4.68%
jan 1, 1974
107.883 mln
+26.31 mln
32.25%
jan 1, 1975
177.83 mln
+69.947 mln
64.84%
jan 1, 1976
195.077 mln
+17.247 mln
9.7%
jan 1, 1977
182.907 mln
-12.17 mln
-6.24%
jan 1, 1978
164.576 mln
-18.331 mln
-10.02%
jan 1, 1979
196.213 mln
+31.637 mln
19.22%
jan 1, 1980
231.978 mln
+35.765 mln
18.23%
jan 1, 1981
369.0 mln
+137.022 mln
59.07%
jan 1, 1982
391.0 mln
+22.0 mln
5.96%
jan 1, 1983
325.0 mln
-66.0 mln
-16.88%
jan 1, 1984
304.0 mln
-21.0 mln
-6.46%
jan 1, 1985
240.0 mln
-64.0 mln
-21.05%
jan 1, 1986
179.0 mln
-61.0 mln
-25.42%
jan 1, 1987
280.0 mln
+101.0 mln
56.42%
jan 1, 1988
423.0 mln
+143.0 mln
51.07%
jan 1, 1989
468.0 mln
+45.0 mln
10.64%
jan 1, 1990
502.0 mln
+34.0 mln
7.26%
jan 1, 1991
556.0 mln
+54.0 mln
10.76%
jan 1, 1992
591.0 mln
+35.0 mln
6.29%
jan 1, 1993
639.0 mln
+48.0 mln
8.12%
jan 1, 1994
680.0 mln
+41.0 mln
6.42%
jan 1, 1995
781.0 mln
+101.0 mln
14.85%
jan 1, 1996
866.0 mln
+85.0 mln
10.88%
jan 1, 1997
856.0 mln
-10.0 mln
-1.15%
jan 1, 1998
962.0 mln
+106.0 mln
12.38%
jan 1, 1999
973.0 mln
+11.0 mln
1.14%
jan 1, 2000
937.0 mln
-36.0 mln
-3.7%
jan 1, 2001
910.0 mln
-27.0 mln
-2.88%
jan 1, 2002
1.054 bln
+144.0 mln
15.82%
jan 1, 2003
1.029 bln
-25.0 mln
-2.37%
jan 1, 2004
1.638 bln
+608.78 mln
59.16%
jan 1, 2005
1.949 bln
+311.25 mln
19.0%
jan 1, 2006
1.64 bln
-309.03 mln
-15.86%
jan 1, 2007
1.66 bln
+20.0 mln
1.22%
jan 1, 2008
1.74 bln
+80.0 mln
4.82%
jan 1, 2009
1.57 bln
-170.0 mln
-9.77%
jan 1, 2010
1.66 bln
+90.0 mln
5.73%
jan 1, 2011
1.8 bln
+140.0 mln
8.43%
jan 1, 2012
1.91 bln
+110.0 mln
6.11%
jan 1, 2013
1.926 bln
+16.0 mln
0.84%
jan 1, 2014
1.895 bln
-31.0 mln
-1.61%
jan 1, 2015
1.902 bln
+7.0 mln
0.37%
jan 1, 2016
1.697 bln
-205.0 mln
-10.78%
Ranking of countries by current statistics by years


Comments: