29
/
en
AIzaSyAYiBZKx7MnpbEhh9jyipgxe19OcubqV5w
April 1, 2024
268263
Tunisia
TUN
true
2
1
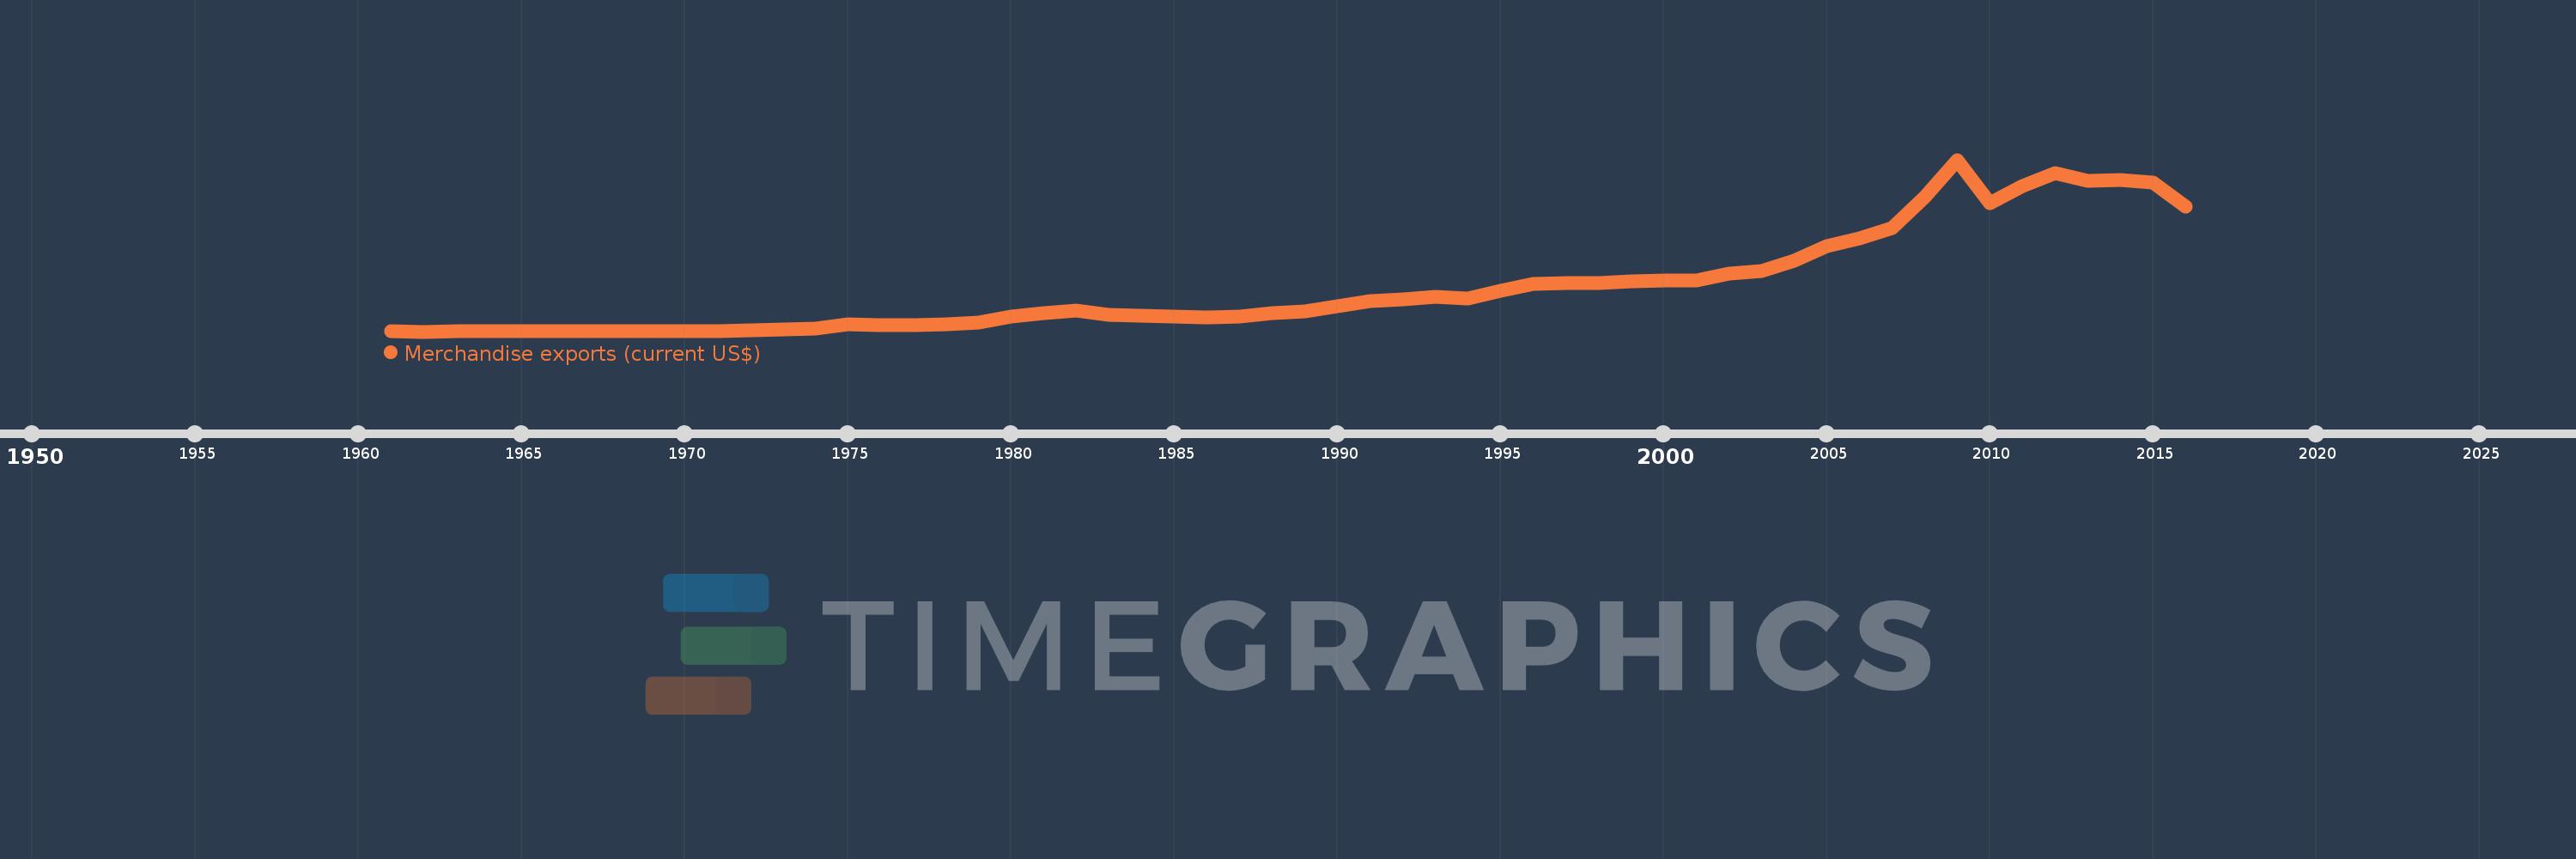
Merchandise exports (current US$)
2016,2015,2014,2013,2012,2011,2010,2009,2008,2007,2006,2005,2004,2003,2002,2001,2000,1999,1998,1997,1996,1995,1994,1993,1992,1991,1990,1989,1988,1987,1986,1985,1984,1983,1982,1981,1980,1979,1978,1977,1976,1975,1974,1973,1972,1971,1970,1969,1968,1967,1966,1965,1964,1963,1962,1961
This statistics in other country:
AfghanistanAlbaniaAlgeriaAmerican SamoaAngolaAntigua and BarbudaArab WorldArgentinaArmeniaArubaAustraliaAustriaAzerbaijanBahamas, TheBahrainBangladeshBarbadosBelarusBelgiumBelizeBeninBermudaBhutanBoliviaBosnia and HerzegovinaBotswanaBrazilBrunei DarussalamBulgariaBurkina FasoBurundiCabo VerdeCambodiaCameroonCanadaCaribbean small statesCentral African RepublicCentral Europe and the BalticsChadChileChinaColombiaComorosCongo, Dem. Rep.Congo, Rep.Costa RicaCote d'IvoireCroatiaCubaCuracaoCyprusCzech RepublicDenmarkDjiboutiDominicaDominican RepublicEarly-demographic dividendEast Asia & PacificEast Asia & Pacific (excluding high income)East Asia & Pacific (IDA & IBRD countries)EcuadorEgypt, Arab Rep.El SalvadorEquatorial GuineaEritreaEstoniaEthiopiaEuro areaEurope & Central AsiaEurope & Central Asia (excluding high income)Europe & Central Asia (IDA & IBRD countries)European UnionFaroe IslandsFijiFinlandFragile and conflict affected situationsFranceFrench PolynesiaGabonGambia, TheGeorgiaGermanyGhanaGreeceGreenlandGrenadaGuamGuatemalaGuineaGuinea-BissauGuyanaHaitiHeavily indebted poor countries (HIPC)High incomeHondurasHong Kong SAR, ChinaHungaryIBRD onlyIcelandIDA & IBRD totalIDA blendIDA onlyIDA totalIndiaIndonesiaIran, Islamic Rep.IraqIrelandIsraelItalyJamaicaJapanJordanKazakhstanKenyaKiribatiKorea, Dem. People’s Rep.Korea, Rep.KuwaitKyrgyz RepublicLao PDRLate-demographic dividendLatin America & Caribbean Latin America & Caribbean (excluding high income)Latin America & the Caribbean (IDA & IBRD countries)LatviaLeast developed countries: UN classificationLebanonLesothoLiberiaLibyaLithuaniaLow & middle incomeLow incomeLower middle incomeLuxembourgMacao SAR, ChinaMacedonia, FYRMadagascarMalawiMalaysiaMaldivesMaliMaltaMarshall IslandsMauritaniaMauritiusMexicoMicronesia, Fed. Sts.Middle East & North AfricaMiddle East & North Africa (excluding high income)Middle East & North Africa (IDA & IBRD countries)Middle incomeMoldovaMongoliaMontenegroMoroccoMozambiqueMyanmarNamibiaNepalNetherlandsNew CaledoniaNew ZealandNicaraguaNigerNigeriaNorth AmericaNorthern Mariana IslandsNorwayOECD membersOmanOther small statesPacific island small statesPakistanPalauPanamaPapua New GuineaParaguayPeruPhilippinesPolandPortugalPost-demographic dividendPre-demographic dividendQatarRomaniaRussian FederationRwandaSamoaSao Tome and PrincipeSaudi ArabiaSenegalSerbiaSeychellesSierra LeoneSingaporeSint Maarten (Dutch part)Slovak RepublicSloveniaSmall statesSolomon IslandsSouth AfricaSouth AsiaSouth Asia (IDA & IBRD)SpainSri LankaSt. Kitts and NevisSt. LuciaSt. Martin (French part)St. Vincent and the GrenadinesSub-Saharan Africa Sub-Saharan Africa (excluding high income)Sub-Saharan Africa (IDA & IBRD countries)SudanSurinameSwazilandSwedenSwitzerlandSyrian Arab RepublicTajikistanTanzaniaThailandTimor-LesteTogoTongaTrinidad and TobagoTunisiaTurkeyTurkmenistanTuvaluUgandaUkraineUnited Arab EmiratesUnited KingdomUnited StatesUpper middle incomeUruguayUzbekistanVanuatuVenezuela, RBVietnamWorldYemen, Rep.ZambiaZimbabwe Timeline:
This timeline shows a graph from 1961 to 2016 of Tunisia. No data until 1960. Number of actual observations by date: 56.
Source name:
World Development Indicators
Source organization:
World Trade Organization.
Categories, topics:
Private Sector, Trade
Last updated:
apr 23, 2017
Indicators value changes by year
Minimum:
110.333 mln
jan 1, 1962
Maximum:
19.32 bln
jan 1, 2009
At the date of observation
Value
Absolute change
Change from previous value
jan 1, 1961
119.69 mln
+119.69 mln
0.0%
jan 1, 1962
110.333 mln
-9.357 mln
-7.82%
jan 1, 1963
115.929 mln
+5.596 mln
5.07%
jan 1, 1964
126.0 mln
+10.071 mln
8.69%
jan 1, 1965
129.689 mln
+3.689 mln
2.93%
jan 1, 1966
119.848 mln
-9.841 mln
-7.59%
jan 1, 1967
140.362 mln
+20.514 mln
17.12%
jan 1, 1968
149.257 mln
+8.895 mln
6.34%
jan 1, 1969
157.771 mln
+8.514 mln
5.7%
jan 1, 1970
165.638 mln
+7.867 mln
4.99%
jan 1, 1971
182.476 mln
+16.838 mln
10.17%
jan 1, 1972
217.439 mln
+34.963 mln
19.16%
jan 1, 1973
315.128 mln
+97.689 mln
44.93%
jan 1, 1974
422.052 mln
+106.924 mln
33.93%
jan 1, 1975
921.399 mln
+499.347 mln
118.31%
jan 1, 1976
855.564 mln
-65.835 mln
-7.15%
jan 1, 1977
787.97 mln
-67.594 mln
-7.9%
jan 1, 1978
929.197 mln
+141.227 mln
17.92%
jan 1, 1979
1.126 bln
+197.193 mln
21.22%
jan 1, 1980
1.791 bln
+664.3 mln
58.98%
jan 1, 1981
2.198 bln
+407.31 mln
22.75%
jan 1, 1982
2.5 bln
+302.0 mln
13.74%
jan 1, 1983
1.986 bln
-514.0 mln
-20.56%
jan 1, 1984
1.85 bln
-136.0 mln
-6.85%
jan 1, 1985
1.794 bln
-56.0 mln
-3.03%
jan 1, 1986
1.738 bln
-56.0 mln
-3.12%
jan 1, 1987
1.759 bln
+21.0 mln
1.21%
jan 1, 1988
2.139 bln
+380.0 mln
21.6%
jan 1, 1989
2.395 bln
+256.0 mln
11.97%
jan 1, 1990
2.93 bln
+535.0 mln
22.34%
jan 1, 1991
3.526 bln
+596.0 mln
20.34%
jan 1, 1992
3.699 bln
+173.0 mln
4.91%
jan 1, 1993
4.019 bln
+320.0 mln
8.65%
jan 1, 1994
3.802 bln
-217.0 mln
-5.4%
jan 1, 1995
4.657 bln
+855.0 mln
22.49%
jan 1, 1996
5.475 bln
+818.0 mln
17.56%
jan 1, 1997
5.516 bln
+41.0 mln
0.75%
jan 1, 1998
5.559 bln
+43.0 mln
0.78%
jan 1, 1999
5.738 bln
+179.0 mln
3.22%
jan 1, 2000
5.872 bln
+134.0 mln
2.34%
jan 1, 2001
5.85 bln
-22.0 mln
-0.37%
jan 1, 2002
6.631 bln
+781.0 mln
13.35%
jan 1, 2003
6.874 bln
+243.28 mln
3.67%
jan 1, 2004
8.027 bln
+1.153 bln
16.77%
jan 1, 2005
9.685 bln
+1.658 bln
20.66%
jan 1, 2006
10.494 bln
+808.79 mln
8.35%
jan 1, 2007
11.694 bln
+1.201 bln
11.44%
jan 1, 2008
15.165 bln
+3.471 bln
29.68%
jan 1, 2009
19.32 bln
+4.155 bln
27.4%
jan 1, 2010
14.445 bln
-4.875 bln
-25.23%
jan 1, 2011
16.427 bln
+1.981 bln
13.72%
jan 1, 2012
17.847 bln
+1.42 bln
8.65%
jan 1, 2013
17.007 bln
-839.519 mln
-4.7%
jan 1, 2014
17.06 bln
+53.019 mln
0.31%
jan 1, 2015
16.756 bln
-304.852 mln
-1.79%
jan 1, 2016
14.073 bln
-2.683 bln
-16.01%
Ranking of countries by current statistics by years


Comments: