29
/
en
AIzaSyAYiBZKx7MnpbEhh9jyipgxe19OcubqV5w
April 1, 2024
100185
Cameroon
CMR
true
2
1
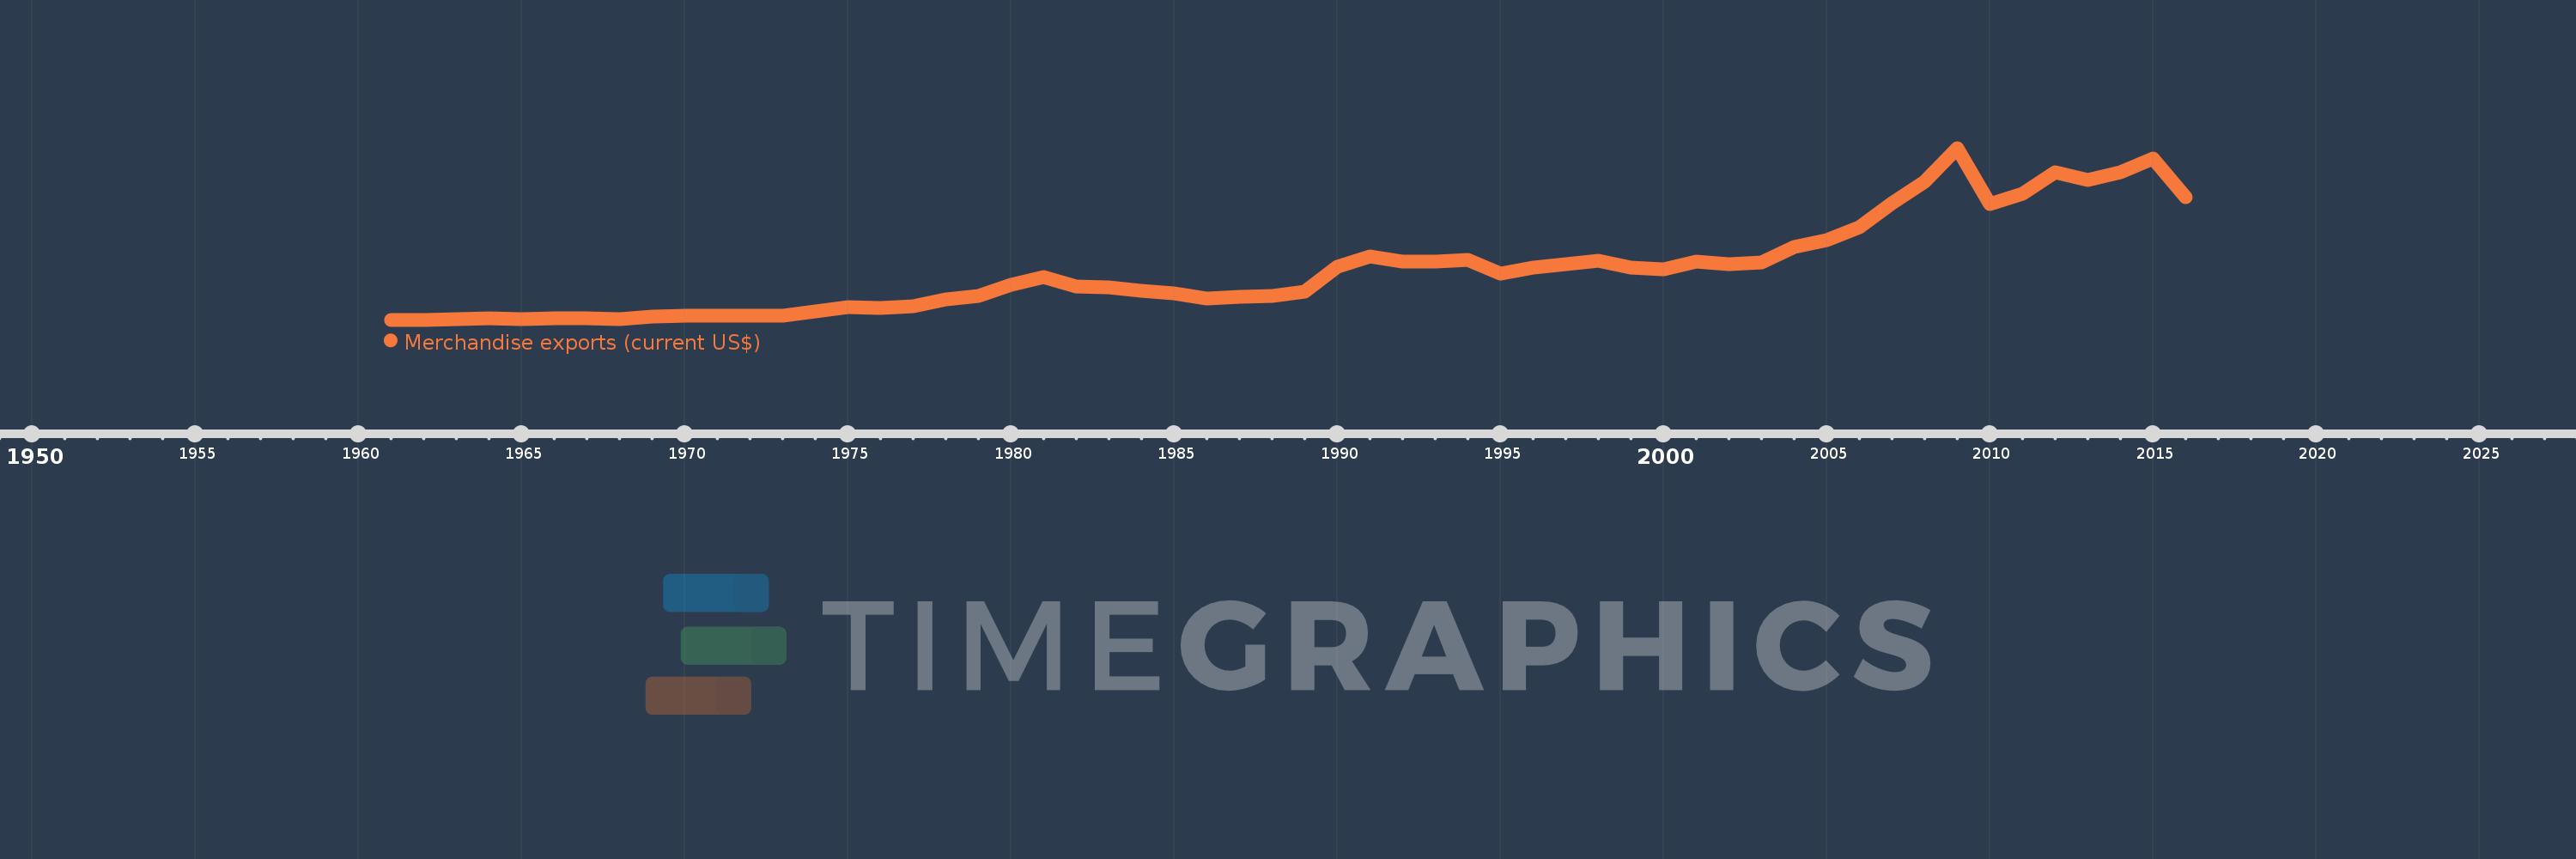
Merchandise exports (current US$)
2016,2015,2014,2013,2012,2011,2010,2009,2008,2007,2006,2005,2004,2003,2002,2001,2000,1999,1998,1997,1996,1995,1994,1993,1992,1991,1990,1989,1988,1987,1986,1985,1984,1983,1982,1981,1980,1979,1978,1977,1976,1975,1974,1973,1972,1971,1970,1969,1968,1967,1966,1965,1964,1963,1962,1961
This statistics in other country:
AfghanistanAlbaniaAlgeriaAmerican SamoaAngolaAntigua and BarbudaArab WorldArgentinaArmeniaArubaAustraliaAustriaAzerbaijanBahamas, TheBahrainBangladeshBarbadosBelarusBelgiumBelizeBeninBermudaBhutanBoliviaBosnia and HerzegovinaBotswanaBrazilBrunei DarussalamBulgariaBurkina FasoBurundiCabo VerdeCambodiaCameroonCanadaCaribbean small statesCentral African RepublicCentral Europe and the BalticsChadChileChinaColombiaComorosCongo, Dem. Rep.Congo, Rep.Costa RicaCote d'IvoireCroatiaCubaCuracaoCyprusCzech RepublicDenmarkDjiboutiDominicaDominican RepublicEarly-demographic dividendEast Asia & PacificEast Asia & Pacific (excluding high income)East Asia & Pacific (IDA & IBRD countries)EcuadorEgypt, Arab Rep.El SalvadorEquatorial GuineaEritreaEstoniaEthiopiaEuro areaEurope & Central AsiaEurope & Central Asia (excluding high income)Europe & Central Asia (IDA & IBRD countries)European UnionFaroe IslandsFijiFinlandFragile and conflict affected situationsFranceFrench PolynesiaGabonGambia, TheGeorgiaGermanyGhanaGreeceGreenlandGrenadaGuamGuatemalaGuineaGuinea-BissauGuyanaHaitiHeavily indebted poor countries (HIPC)High incomeHondurasHong Kong SAR, ChinaHungaryIBRD onlyIcelandIDA & IBRD totalIDA blendIDA onlyIDA totalIndiaIndonesiaIran, Islamic Rep.IraqIrelandIsraelItalyJamaicaJapanJordanKazakhstanKenyaKiribatiKorea, Dem. People’s Rep.Korea, Rep.KuwaitKyrgyz RepublicLao PDRLate-demographic dividendLatin America & Caribbean Latin America & Caribbean (excluding high income)Latin America & the Caribbean (IDA & IBRD countries)LatviaLeast developed countries: UN classificationLebanonLesothoLiberiaLibyaLithuaniaLow & middle incomeLow incomeLower middle incomeLuxembourgMacao SAR, ChinaMacedonia, FYRMadagascarMalawiMalaysiaMaldivesMaliMaltaMarshall IslandsMauritaniaMauritiusMexicoMicronesia, Fed. Sts.Middle East & North AfricaMiddle East & North Africa (excluding high income)Middle East & North Africa (IDA & IBRD countries)Middle incomeMoldovaMongoliaMontenegroMoroccoMozambiqueMyanmarNamibiaNepalNetherlandsNew CaledoniaNew ZealandNicaraguaNigerNigeriaNorth AmericaNorthern Mariana IslandsNorwayOECD membersOmanOther small statesPacific island small statesPakistanPalauPanamaPapua New GuineaParaguayPeruPhilippinesPolandPortugalPost-demographic dividendPre-demographic dividendQatarRomaniaRussian FederationRwandaSamoaSao Tome and PrincipeSaudi ArabiaSenegalSerbiaSeychellesSierra LeoneSingaporeSint Maarten (Dutch part)Slovak RepublicSloveniaSmall statesSolomon IslandsSouth AfricaSouth AsiaSouth Asia (IDA & IBRD)SpainSri LankaSt. Kitts and NevisSt. LuciaSt. Martin (French part)St. Vincent and the GrenadinesSub-Saharan Africa Sub-Saharan Africa (excluding high income)Sub-Saharan Africa (IDA & IBRD countries)SudanSurinameSwazilandSwedenSwitzerlandSyrian Arab RepublicTajikistanTanzaniaThailandTimor-LesteTogoTongaTrinidad and TobagoTunisiaTurkeyTurkmenistanTuvaluUgandaUkraineUnited Arab EmiratesUnited KingdomUnited StatesUpper middle incomeUruguayUzbekistanVanuatuVenezuela, RBVietnamWorldYemen, Rep.ZambiaZimbabwe Timeline:
This timeline shows a graph from 1961 to 2016 of Cameroon. No data until 1960. Number of actual observations by date: 56.
Source name:
World Development Indicators
Source organization:
World Trade Organization.
Categories, topics:
Private Sector, Trade
Last updated:
apr 23, 2017
Indicators value changes by year
Minimum:
97.0 mln
jan 1, 1961
Maximum:
5.241 bln
jan 1, 2009
At the date of observation
Value
Absolute change
Change from previous value
jan 1, 1961
97.0 mln
+97.0 mln
0.0%
jan 1, 1962
98.0 mln
+1000.0K
1.03%
jan 1, 1963
103.0 mln
+5.0 mln
5.1%
jan 1, 1964
134.809 mln
+31.809 mln
30.88%
jan 1, 1965
124.916 mln
-9.893 mln
-7.34%
jan 1, 1966
144.446 mln
+19.53 mln
15.63%
jan 1, 1967
131.305 mln
-13.141 mln
-9.1%
jan 1, 1968
121.384 mln
-9.921 mln
-7.56%
jan 1, 1969
189.275 mln
+67.891 mln
55.93%
jan 1, 1970
225.185 mln
+35.91 mln
18.97%
jan 1, 1971
226.064 mln
+879.0K
0.39%
jan 1, 1972
206.998 mln
-19.066 mln
-8.43%
jan 1, 1973
220.887 mln
+13.889 mln
6.71%
jan 1, 1974
352.866 mln
+131.979 mln
59.75%
jan 1, 1975
477.883 mln
+125.017 mln
35.43%
jan 1, 1976
447.227 mln
-30.656 mln
-6.41%
jan 1, 1977
510.879 mln
+63.652 mln
14.23%
jan 1, 1978
704.102 mln
+193.223 mln
37.82%
jan 1, 1979
802.429 mln
+98.327 mln
13.96%
jan 1, 1980
1.132 bln
+329.141 mln
41.02%
jan 1, 1981
1.384 bln
+252.43 mln
22.31%
jan 1, 1982
1.105 bln
-279.0 mln
-20.16%
jan 1, 1983
1.064 bln
-41.0 mln
-3.71%
jan 1, 1984
976.0 mln
-88.0 mln
-8.27%
jan 1, 1985
886.0 mln
-90.0 mln
-9.22%
jan 1, 1986
722.0 mln
-164.0 mln
-18.51%
jan 1, 1987
782.0 mln
+60.0 mln
8.31%
jan 1, 1988
806.0 mln
+24.0 mln
3.07%
jan 1, 1989
927.0 mln
+121.0 mln
15.01%
jan 1, 1990
1.682 bln
+755.0 mln
81.45%
jan 1, 1991
2.002 bln
+320.0 mln
19.02%
jan 1, 1992
1.834 bln
-168.0 mln
-8.39%
jan 1, 1993
1.84 bln
+6.0 mln
0.33%
jan 1, 1994
1.883 bln
+43.0 mln
2.34%
jan 1, 1995
1.486 bln
-397.0 mln
-21.08%
jan 1, 1996
1.651 bln
+165.0 mln
11.1%
jan 1, 1997
1.768 bln
+117.0 mln
7.09%
jan 1, 1998
1.86 bln
+92.0 mln
5.2%
jan 1, 1999
1.671 bln
-189.0 mln
-10.16%
jan 1, 2000
1.601 bln
-70.0 mln
-4.19%
jan 1, 2001
1.833 bln
+232.0 mln
14.49%
jan 1, 2002
1.749 bln
-84.0 mln
-4.58%
jan 1, 2003
1.802 bln
+53.0 mln
3.03%
jan 1, 2004
2.283 bln
+480.56 mln
26.67%
jan 1, 2005
2.477 bln
+194.202 mln
8.51%
jan 1, 2006
2.861 bln
+384.483 mln
15.52%
jan 1, 2007
3.576 bln
+715.175 mln
25.0%
jan 1, 2008
4.23 bln
+653.695 mln
18.28%
jan 1, 2009
5.241 bln
+1.011 bln
23.9%
jan 1, 2010
3.552 bln
-1.689 bln
-32.22%
jan 1, 2011
3.878 bln
+326.252 mln
9.18%
jan 1, 2012
4.517 bln
+638.595 mln
16.47%
jan 1, 2013
4.274 bln
-243.013 mln
-5.38%
jan 1, 2014
4.514 bln
+239.79 mln
5.61%
jan 1, 2015
4.926 bln
+412.013 mln
9.13%
jan 1, 2016
3.76 bln
-1.166 bln
-23.67%
Ranking of countries by current statistics by years


Comments: