29
/
en
AIzaSyAYiBZKx7MnpbEhh9jyipgxe19OcubqV5w
April 1, 2024
201850
Morocco
MAR
true
2
1
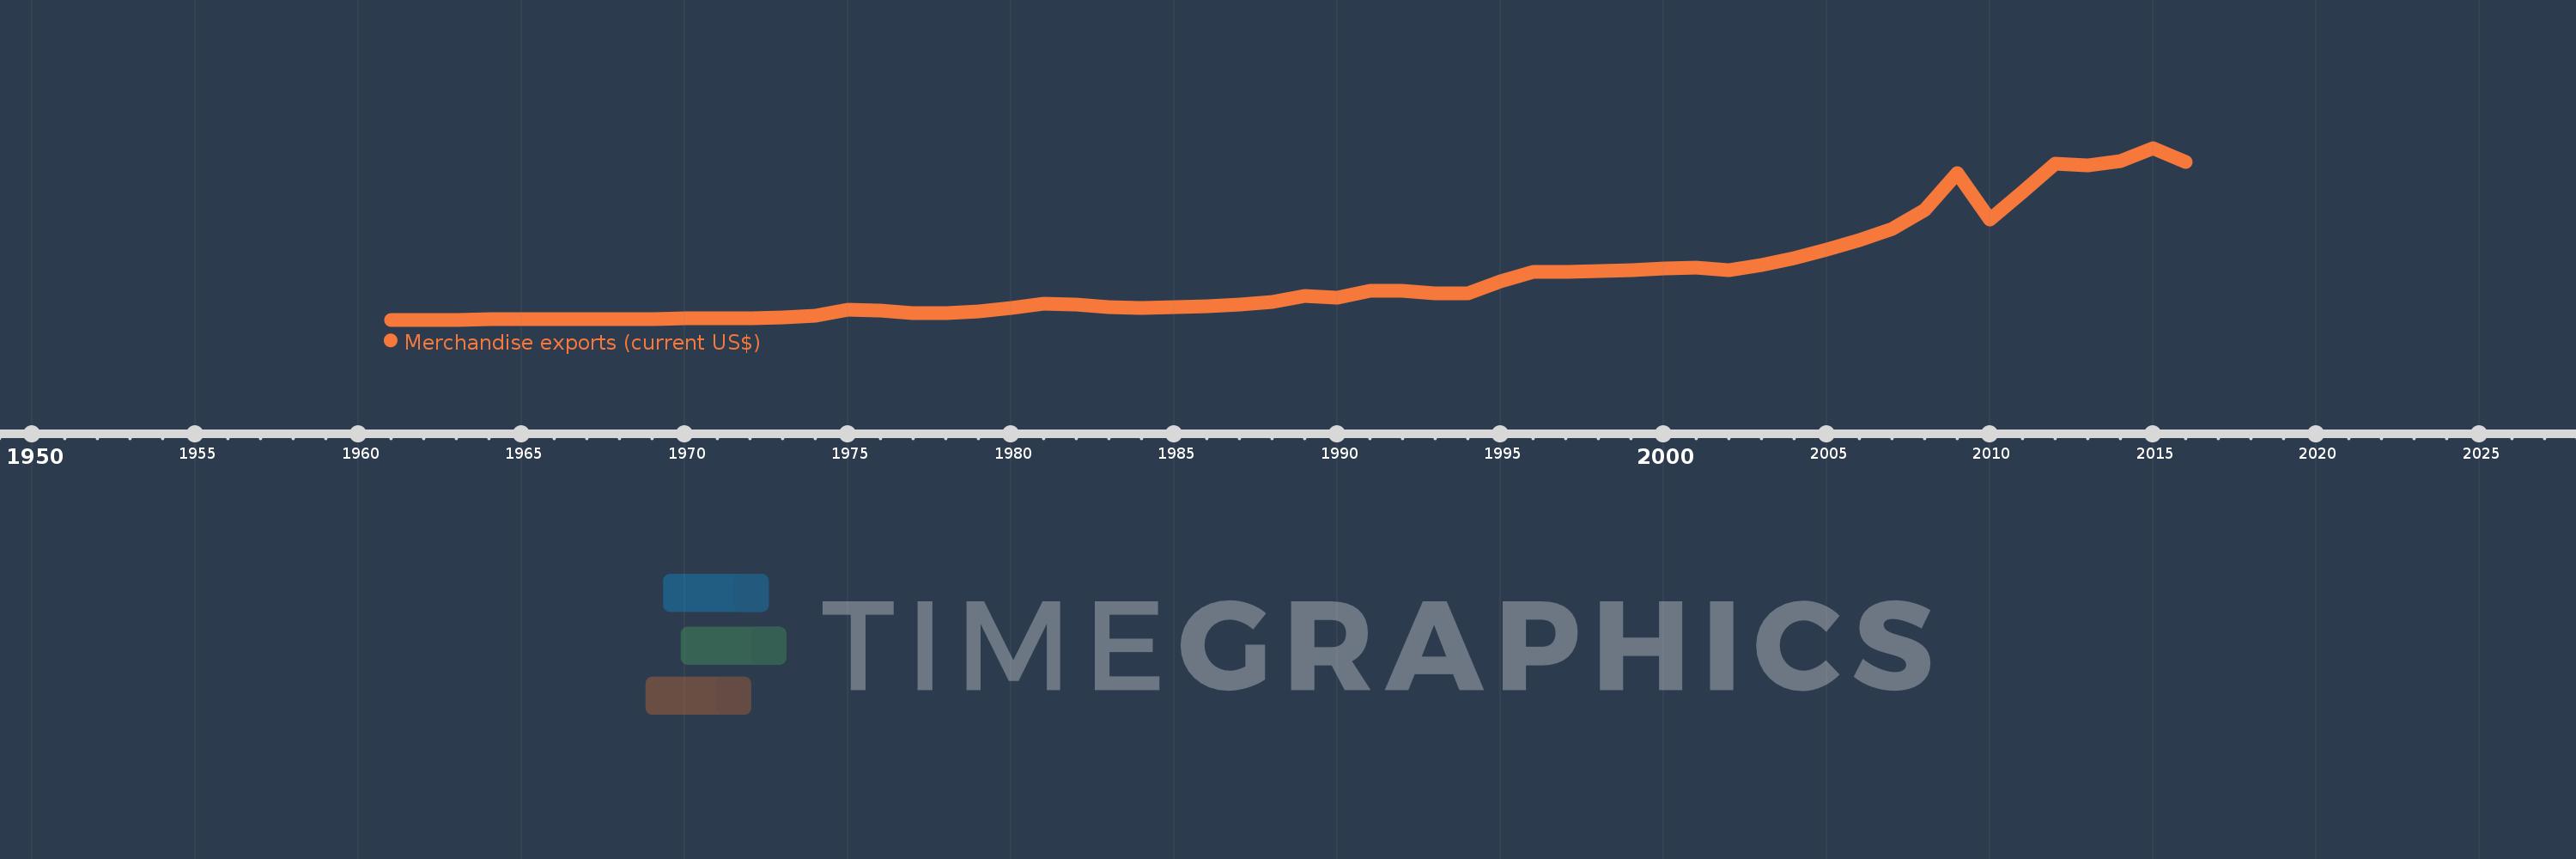
Merchandise exports (current US$)
2016,2015,2014,2013,2012,2011,2010,2009,2008,2007,2006,2005,2004,2003,2002,2001,2000,1999,1998,1997,1996,1995,1994,1993,1992,1991,1990,1989,1988,1987,1986,1985,1984,1983,1982,1981,1980,1979,1978,1977,1976,1975,1974,1973,1972,1971,1970,1969,1968,1967,1966,1965,1964,1963,1962,1961
This statistics in other country:
AfghanistanAlbaniaAlgeriaAmerican SamoaAngolaAntigua and BarbudaArab WorldArgentinaArmeniaArubaAustraliaAustriaAzerbaijanBahamas, TheBahrainBangladeshBarbadosBelarusBelgiumBelizeBeninBermudaBhutanBoliviaBosnia and HerzegovinaBotswanaBrazilBrunei DarussalamBulgariaBurkina FasoBurundiCabo VerdeCambodiaCameroonCanadaCaribbean small statesCentral African RepublicCentral Europe and the BalticsChadChileChinaColombiaComorosCongo, Dem. Rep.Congo, Rep.Costa RicaCote d'IvoireCroatiaCubaCuracaoCyprusCzech RepublicDenmarkDjiboutiDominicaDominican RepublicEarly-demographic dividendEast Asia & PacificEast Asia & Pacific (excluding high income)East Asia & Pacific (IDA & IBRD countries)EcuadorEgypt, Arab Rep.El SalvadorEquatorial GuineaEritreaEstoniaEthiopiaEuro areaEurope & Central AsiaEurope & Central Asia (excluding high income)Europe & Central Asia (IDA & IBRD countries)European UnionFaroe IslandsFijiFinlandFragile and conflict affected situationsFranceFrench PolynesiaGabonGambia, TheGeorgiaGermanyGhanaGreeceGreenlandGrenadaGuamGuatemalaGuineaGuinea-BissauGuyanaHaitiHeavily indebted poor countries (HIPC)High incomeHondurasHong Kong SAR, ChinaHungaryIBRD onlyIcelandIDA & IBRD totalIDA blendIDA onlyIDA totalIndiaIndonesiaIran, Islamic Rep.IraqIrelandIsraelItalyJamaicaJapanJordanKazakhstanKenyaKiribatiKorea, Dem. People’s Rep.Korea, Rep.KuwaitKyrgyz RepublicLao PDRLate-demographic dividendLatin America & Caribbean Latin America & Caribbean (excluding high income)Latin America & the Caribbean (IDA & IBRD countries)LatviaLeast developed countries: UN classificationLebanonLesothoLiberiaLibyaLithuaniaLow & middle incomeLow incomeLower middle incomeLuxembourgMacao SAR, ChinaMacedonia, FYRMadagascarMalawiMalaysiaMaldivesMaliMaltaMarshall IslandsMauritaniaMauritiusMexicoMicronesia, Fed. Sts.Middle East & North AfricaMiddle East & North Africa (excluding high income)Middle East & North Africa (IDA & IBRD countries)Middle incomeMoldovaMongoliaMontenegroMoroccoMozambiqueMyanmarNamibiaNepalNetherlandsNew CaledoniaNew ZealandNicaraguaNigerNigeriaNorth AmericaNorthern Mariana IslandsNorwayOECD membersOmanOther small statesPacific island small statesPakistanPalauPanamaPapua New GuineaParaguayPeruPhilippinesPolandPortugalPost-demographic dividendPre-demographic dividendQatarRomaniaRussian FederationRwandaSamoaSao Tome and PrincipeSaudi ArabiaSenegalSerbiaSeychellesSierra LeoneSingaporeSint Maarten (Dutch part)Slovak RepublicSloveniaSmall statesSolomon IslandsSouth AfricaSouth AsiaSouth Asia (IDA & IBRD)SpainSri LankaSt. Kitts and NevisSt. LuciaSt. Martin (French part)St. Vincent and the GrenadinesSub-Saharan Africa Sub-Saharan Africa (excluding high income)Sub-Saharan Africa (IDA & IBRD countries)SudanSurinameSwazilandSwedenSwitzerlandSyrian Arab RepublicTajikistanTanzaniaThailandTimor-LesteTogoTongaTrinidad and TobagoTunisiaTurkeyTurkmenistanTuvaluUgandaUkraineUnited Arab EmiratesUnited KingdomUnited StatesUpper middle incomeUruguayUzbekistanVanuatuVenezuela, RBVietnamWorldYemen, Rep.ZambiaZimbabwe Timeline:
This timeline shows a graph from 1961 to 2016 of Morocco. No data until 1960. Number of actual observations by date: 56.
Source name:
World Development Indicators
Source organization:
World Trade Organization.
Categories, topics:
Private Sector, Trade
Last updated:
apr 23, 2017
Indicators value changes by year
Minimum:
342.062 mln
jan 1, 1962
Maximum:
23.826 bln
jan 1, 2015
At the date of observation
Value
Absolute change
Change from previous value
jan 1, 1961
353.721 mln
+353.721 mln
0.0%
jan 1, 1962
342.062 mln
-11.659 mln
-3.3%
jan 1, 1963
348.583 mln
+6.521 mln
1.91%
jan 1, 1964
384.153 mln
+35.57 mln
10.2%
jan 1, 1965
432.172 mln
+48.019 mln
12.5%
jan 1, 1966
430.195 mln
-1.977 mln
-0.46%
jan 1, 1967
428.417 mln
-1.778 mln
-0.41%
jan 1, 1968
424.07 mln
-4.347 mln
-1.01%
jan 1, 1969
450.352 mln
+26.282 mln
6.2%
jan 1, 1970
485.131 mln
+34.779 mln
7.72%
jan 1, 1971
488.293 mln
+3.162 mln
0.65%
jan 1, 1972
502.018 mln
+13.725 mln
2.81%
jan 1, 1973
643.057 mln
+141.039 mln
28.09%
jan 1, 1974
910.118 mln
+267.061 mln
41.53%
jan 1, 1975
1.708 bln
+797.622 mln
87.64%
jan 1, 1976
1.543 bln
-164.6 mln
-9.64%
jan 1, 1977
1.261 bln
-282.02 mln
-18.28%
jan 1, 1978
1.302 bln
+40.98 mln
3.25%
jan 1, 1979
1.508 bln
+205.7 mln
15.8%
jan 1, 1980
1.959 bln
+451.03 mln
29.91%
jan 1, 1981
2.493 bln
+534.17 mln
27.27%
jan 1, 1982
2.386 bln
-107.0 mln
-4.29%
jan 1, 1983
2.062 bln
-324.0 mln
-13.58%
jan 1, 1984
2.006 bln
-56.0 mln
-2.72%
jan 1, 1985
2.08 bln
+74.0 mln
3.69%
jan 1, 1986
2.165 bln
+85.0 mln
4.09%
jan 1, 1987
2.454 bln
+289.0 mln
13.35%
jan 1, 1988
2.826 bln
+372.0 mln
15.16%
jan 1, 1989
3.603 bln
+777.0 mln
27.49%
jan 1, 1990
3.307 bln
-296.0 mln
-8.22%
jan 1, 1991
4.265 bln
+958.0 mln
28.97%
jan 1, 1992
4.284 bln
+19.0 mln
0.45%
jan 1, 1993
3.973 bln
-311.0 mln
-7.26%
jan 1, 1994
3.991 bln
+18.0 mln
0.45%
jan 1, 1995
5.556 bln
+1.565 bln
39.21%
jan 1, 1996
6.881 bln
+1.325 bln
23.85%
jan 1, 1997
6.881 bln
0.0
0.0%
jan 1, 1998
7.032 bln
+151.0 mln
2.19%
jan 1, 1999
7.153 bln
+121.0 mln
1.72%
jan 1, 2000
7.367 bln
+214.0 mln
2.99%
jan 1, 2001
7.432 bln
+65.0 mln
0.88%
jan 1, 2002
7.144 bln
-288.0 mln
-3.88%
jan 1, 2003
7.849 bln
+705.0 mln
9.87%
jan 1, 2004
8.778 bln
+929.33 mln
11.84%
jan 1, 2005
9.925 bln
+1.147 bln
13.06%
jan 1, 2006
11.19 bln
+1.265 bln
12.74%
jan 1, 2007
12.744 bln
+1.554 bln
13.89%
jan 1, 2008
15.34 bln
+2.596 bln
20.37%
jan 1, 2009
20.345 bln
+5.005 bln
32.63%
jan 1, 2010
14.054 bln
-6.291 bln
-30.92%
jan 1, 2011
17.771 bln
+3.716 bln
26.44%
jan 1, 2012
21.654 bln
+3.883 bln
21.85%
jan 1, 2013
21.446 bln
-208.208 mln
-0.96%
jan 1, 2014
21.972 bln
+525.86 mln
2.45%
jan 1, 2015
23.826 bln
+1.854 bln
8.44%
jan 1, 2016
21.886 bln
-1.94 bln
-8.14%
Ranking of countries by current statistics by years


Comments: