29
/
en
AIzaSyAYiBZKx7MnpbEhh9jyipgxe19OcubqV5w
April 1, 2024
176658
Lebanon
LBN
true
2
1
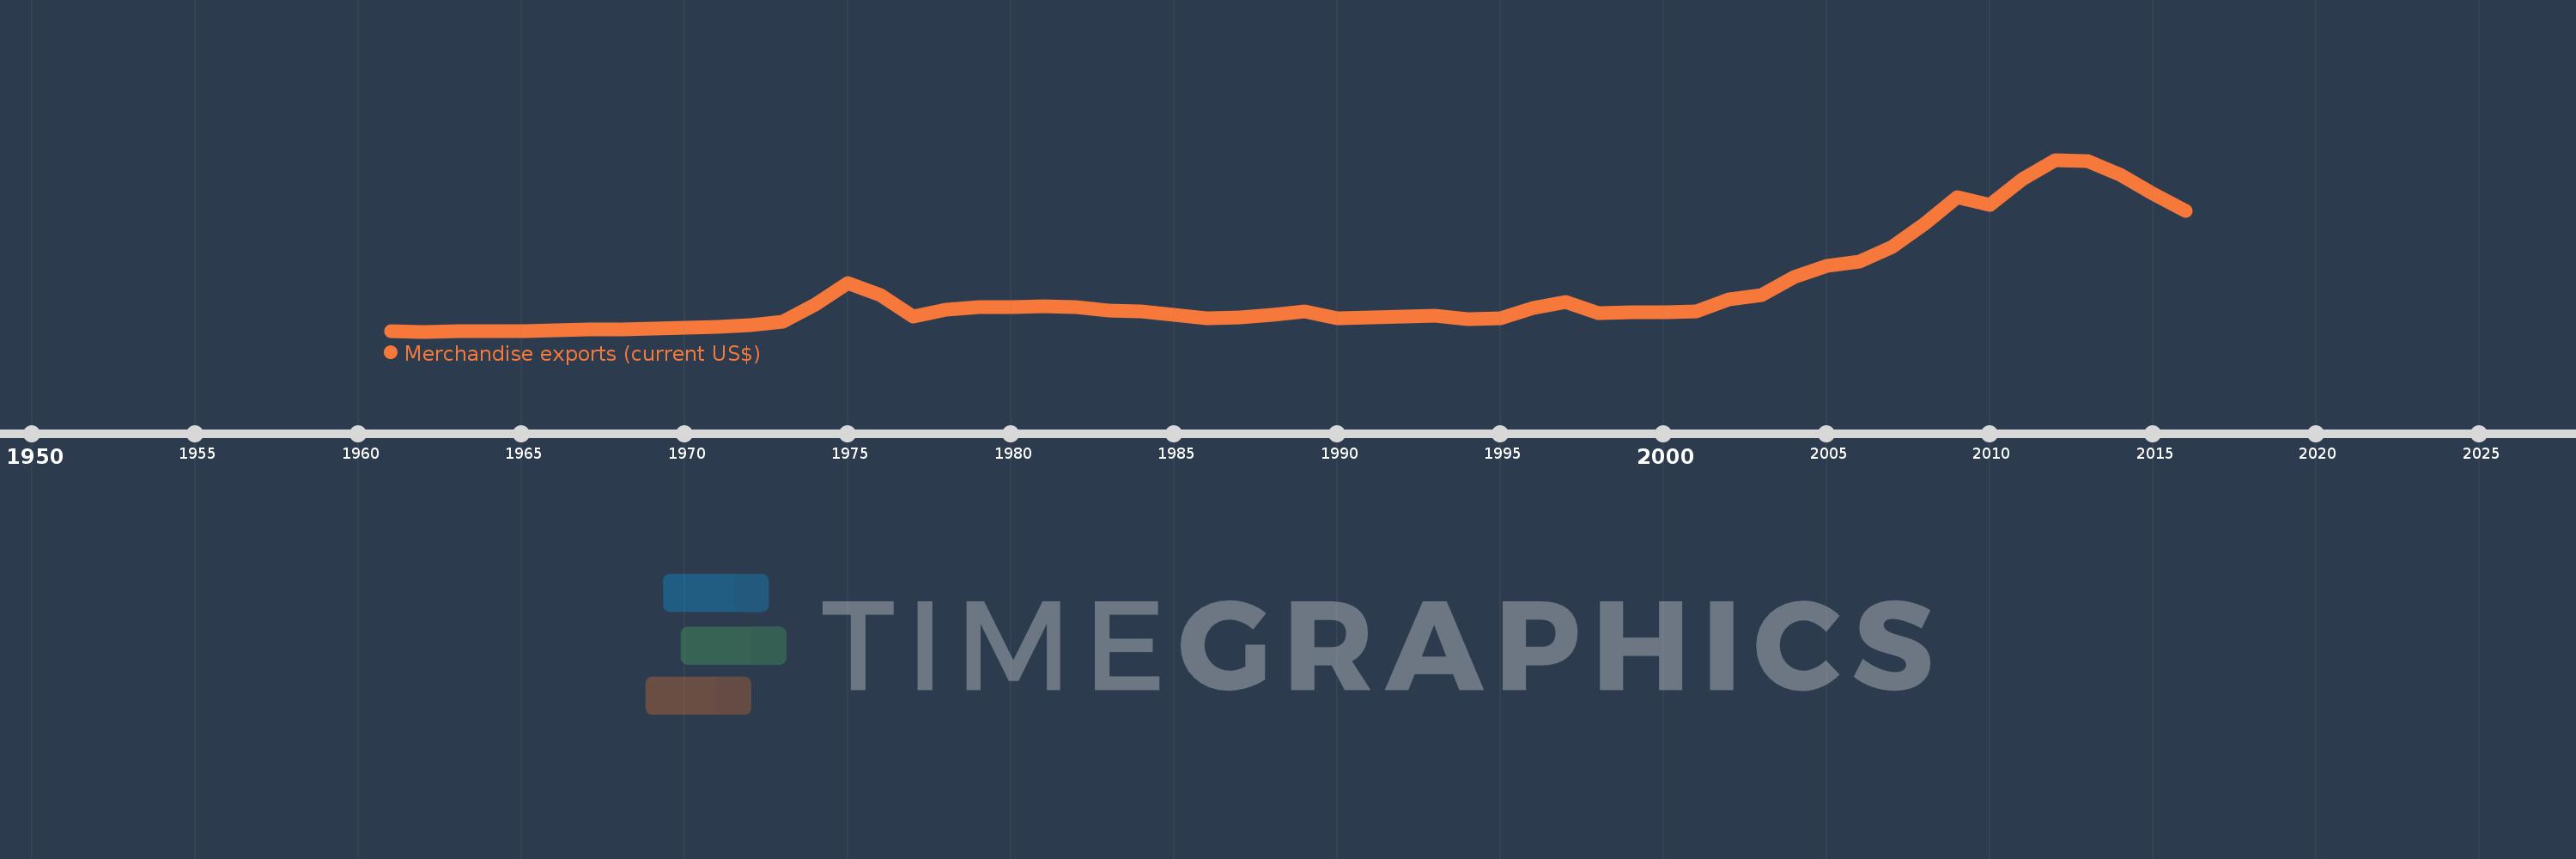
Merchandise exports (current US$)
2016,2015,2014,2013,2012,2011,2010,2009,2008,2007,2006,2005,2004,2003,2002,2001,2000,1999,1998,1997,1996,1995,1994,1993,1992,1991,1990,1989,1988,1987,1986,1985,1984,1983,1982,1981,1980,1979,1978,1977,1976,1975,1974,1973,1972,1971,1970,1969,1968,1967,1966,1965,1964,1963,1962,1961
This statistics in other country:
AfghanistanAlbaniaAlgeriaAmerican SamoaAngolaAntigua and BarbudaArab WorldArgentinaArmeniaArubaAustraliaAustriaAzerbaijanBahamas, TheBahrainBangladeshBarbadosBelarusBelgiumBelizeBeninBermudaBhutanBoliviaBosnia and HerzegovinaBotswanaBrazilBrunei DarussalamBulgariaBurkina FasoBurundiCabo VerdeCambodiaCameroonCanadaCaribbean small statesCentral African RepublicCentral Europe and the BalticsChadChileChinaColombiaComorosCongo, Dem. Rep.Congo, Rep.Costa RicaCote d'IvoireCroatiaCubaCuracaoCyprusCzech RepublicDenmarkDjiboutiDominicaDominican RepublicEarly-demographic dividendEast Asia & PacificEast Asia & Pacific (excluding high income)East Asia & Pacific (IDA & IBRD countries)EcuadorEgypt, Arab Rep.El SalvadorEquatorial GuineaEritreaEstoniaEthiopiaEuro areaEurope & Central AsiaEurope & Central Asia (excluding high income)Europe & Central Asia (IDA & IBRD countries)European UnionFaroe IslandsFijiFinlandFragile and conflict affected situationsFranceFrench PolynesiaGabonGambia, TheGeorgiaGermanyGhanaGreeceGreenlandGrenadaGuamGuatemalaGuineaGuinea-BissauGuyanaHaitiHeavily indebted poor countries (HIPC)High incomeHondurasHong Kong SAR, ChinaHungaryIBRD onlyIcelandIDA & IBRD totalIDA blendIDA onlyIDA totalIndiaIndonesiaIran, Islamic Rep.IraqIrelandIsraelItalyJamaicaJapanJordanKazakhstanKenyaKiribatiKorea, Dem. People’s Rep.Korea, Rep.KuwaitKyrgyz RepublicLao PDRLate-demographic dividendLatin America & Caribbean Latin America & Caribbean (excluding high income)Latin America & the Caribbean (IDA & IBRD countries)LatviaLeast developed countries: UN classificationLebanonLesothoLiberiaLibyaLithuaniaLow & middle incomeLow incomeLower middle incomeLuxembourgMacao SAR, ChinaMacedonia, FYRMadagascarMalawiMalaysiaMaldivesMaliMaltaMarshall IslandsMauritaniaMauritiusMexicoMicronesia, Fed. Sts.Middle East & North AfricaMiddle East & North Africa (excluding high income)Middle East & North Africa (IDA & IBRD countries)Middle incomeMoldovaMongoliaMontenegroMoroccoMozambiqueMyanmarNamibiaNepalNetherlandsNew CaledoniaNew ZealandNicaraguaNigerNigeriaNorth AmericaNorthern Mariana IslandsNorwayOECD membersOmanOther small statesPacific island small statesPakistanPalauPanamaPapua New GuineaParaguayPeruPhilippinesPolandPortugalPost-demographic dividendPre-demographic dividendQatarRomaniaRussian FederationRwandaSamoaSao Tome and PrincipeSaudi ArabiaSenegalSerbiaSeychellesSierra LeoneSingaporeSint Maarten (Dutch part)Slovak RepublicSloveniaSmall statesSolomon IslandsSouth AfricaSouth AsiaSouth Asia (IDA & IBRD)SpainSri LankaSt. Kitts and NevisSt. LuciaSt. Martin (French part)St. Vincent and the GrenadinesSub-Saharan Africa Sub-Saharan Africa (excluding high income)Sub-Saharan Africa (IDA & IBRD countries)SudanSurinameSwazilandSwedenSwitzerlandSyrian Arab RepublicTajikistanTanzaniaThailandTimor-LesteTogoTongaTrinidad and TobagoTunisiaTurkeyTurkmenistanTuvaluUgandaUkraineUnited Arab EmiratesUnited KingdomUnited StatesUpper middle incomeUruguayUzbekistanVanuatuVenezuela, RBVietnamWorldYemen, Rep.ZambiaZimbabwe Timeline:
This timeline shows a graph from 1961 to 2016 of Lebanon. No data until 1960. Number of actual observations by date: 56.
Source name:
World Development Indicators
Source organization:
World Trade Organization.
Categories, topics:
Private Sector, Trade
Last updated:
apr 23, 2017
Indicators value changes by year
Minimum:
41.0 mln
jan 1, 1962
Maximum:
5.664 bln
jan 1, 2012
At the date of observation
Value
Absolute change
Change from previous value
jan 1, 1961
43.0 mln
+43.0 mln
0.0%
jan 1, 1962
41.0 mln
-2.0 mln
-4.65%
jan 1, 1963
59.0 mln
+18.0 mln
43.9%
jan 1, 1964
57.0 mln
-2.0 mln
-3.39%
jan 1, 1965
64.776 mln
+7.776 mln
13.64%
jan 1, 1966
86.87 mln
+22.094 mln
34.11%
jan 1, 1967
103.035 mln
+16.165 mln
18.61%
jan 1, 1968
118.448 mln
+15.413 mln
14.96%
jan 1, 1969
147.48 mln
+29.032 mln
24.51%
jan 1, 1970
165.207 mln
+17.727 mln
12.02%
jan 1, 1971
189.979 mln
+24.772 mln
14.99%
jan 1, 1972
244.524 mln
+54.545 mln
28.71%
jan 1, 1973
377.337 mln
+132.813 mln
54.31%
jan 1, 1974
921.0 mln
+543.663 mln
144.08%
jan 1, 1975
1.636 bln
+715.0 mln
77.63%
jan 1, 1976
1.233 bln
-403.0 mln
-24.63%
jan 1, 1977
546.0 mln
-687.0 mln
-55.72%
jan 1, 1978
760.0 mln
+214.0 mln
39.19%
jan 1, 1979
830.0 mln
+70.0 mln
9.21%
jan 1, 1980
850.0 mln
+20.0 mln
2.41%
jan 1, 1981
868.0 mln
+18.0 mln
2.12%
jan 1, 1982
836.0 mln
-32.0 mln
-3.69%
jan 1, 1983
727.0 mln
-109.0 mln
-13.04%
jan 1, 1984
691.0 mln
-36.0 mln
-4.95%
jan 1, 1985
582.0 mln
-109.0 mln
-15.77%
jan 1, 1986
482.0 mln
-100.0 mln
-17.18%
jan 1, 1987
500.0 mln
+18.0 mln
3.73%
jan 1, 1988
591.0 mln
+91.0 mln
18.2%
jan 1, 1989
709.0 mln
+118.0 mln
19.97%
jan 1, 1990
485.0 mln
-224.0 mln
-31.59%
jan 1, 1991
494.0 mln
+9.0 mln
1.86%
jan 1, 1992
539.0 mln
+45.0 mln
9.11%
jan 1, 1993
560.0 mln
+21.0 mln
3.9%
jan 1, 1994
452.0 mln
-108.0 mln
-19.29%
jan 1, 1995
470.0 mln
+18.0 mln
3.98%
jan 1, 1996
816.0 mln
+346.0 mln
73.62%
jan 1, 1997
1.02 bln
+204.0 mln
25.0%
jan 1, 1998
643.0 mln
-377.0 mln
-36.96%
jan 1, 1999
662.0 mln
+19.0 mln
2.95%
jan 1, 2000
677.0 mln
+15.0 mln
2.27%
jan 1, 2001
715.0 mln
+38.0 mln
5.61%
jan 1, 2002
1.093 bln
+378.0 mln
52.87%
jan 1, 2003
1.238 bln
+145.0 mln
13.27%
jan 1, 2004
1.813 bln
+575.0 mln
46.45%
jan 1, 2005
2.199 bln
+386.0 mln
21.29%
jan 1, 2006
2.337 bln
+138.0 mln
6.28%
jan 1, 2007
2.814 bln
+477.0 mln
20.41%
jan 1, 2008
3.574 bln
+760.0 mln
27.01%
jan 1, 2009
4.454 bln
+880.0 mln
24.62%
jan 1, 2010
4.187 bln
-267.0 mln
-5.99%
jan 1, 2011
5.021 bln
+834.0 mln
19.92%
jan 1, 2012
5.664 bln
+643.0 mln
12.81%
jan 1, 2013
5.615 bln
-49.0 mln
-0.87%
jan 1, 2014
5.17 bln
-445.314 mln
-7.93%
jan 1, 2015
4.548 bln
-621.686 mln
-12.03%
jan 1, 2016
3.982 bln
-566.46 mln
-12.46%
Ranking of countries by current statistics by years


Comments: