29
/
en
AIzaSyAYiBZKx7MnpbEhh9jyipgxe19OcubqV5w
April 1, 2024
103857
Chad
TCD
true
2
1
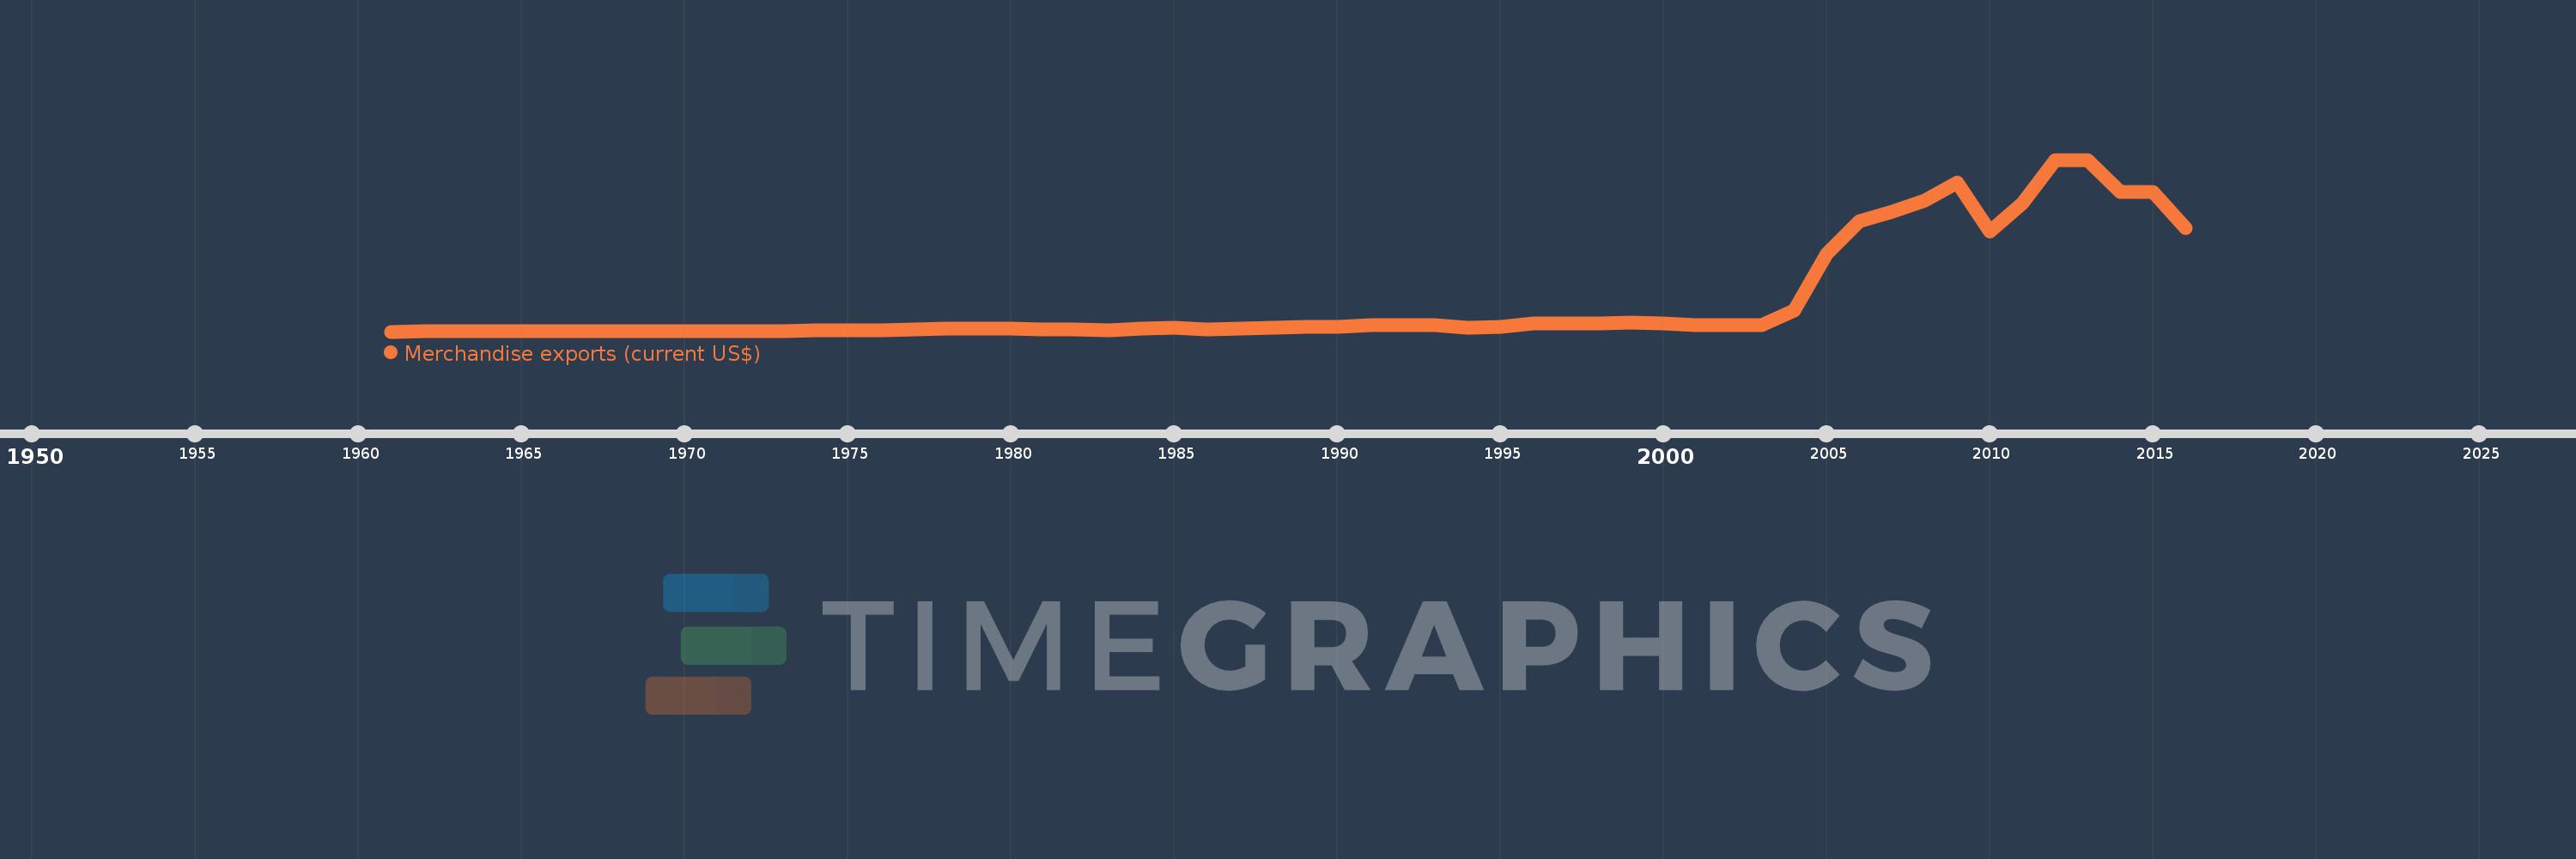
Merchandise exports (current US$)
2016,2015,2014,2013,2012,2011,2010,2009,2008,2007,2006,2005,2004,2003,2002,2001,2000,1999,1998,1997,1996,1995,1994,1993,1992,1991,1990,1989,1988,1987,1986,1985,1984,1983,1982,1981,1980,1979,1978,1977,1976,1975,1974,1973,1972,1971,1970,1969,1968,1967,1966,1965,1964,1963,1962,1961
This statistics in other country:
AfghanistanAlbaniaAlgeriaAmerican SamoaAngolaAntigua and BarbudaArab WorldArgentinaArmeniaArubaAustraliaAustriaAzerbaijanBahamas, TheBahrainBangladeshBarbadosBelarusBelgiumBelizeBeninBermudaBhutanBoliviaBosnia and HerzegovinaBotswanaBrazilBrunei DarussalamBulgariaBurkina FasoBurundiCabo VerdeCambodiaCameroonCanadaCaribbean small statesCentral African RepublicCentral Europe and the BalticsChadChileChinaColombiaComorosCongo, Dem. Rep.Congo, Rep.Costa RicaCote d'IvoireCroatiaCubaCuracaoCyprusCzech RepublicDenmarkDjiboutiDominicaDominican RepublicEarly-demographic dividendEast Asia & PacificEast Asia & Pacific (excluding high income)East Asia & Pacific (IDA & IBRD countries)EcuadorEgypt, Arab Rep.El SalvadorEquatorial GuineaEritreaEstoniaEthiopiaEuro areaEurope & Central AsiaEurope & Central Asia (excluding high income)Europe & Central Asia (IDA & IBRD countries)European UnionFaroe IslandsFijiFinlandFragile and conflict affected situationsFranceFrench PolynesiaGabonGambia, TheGeorgiaGermanyGhanaGreeceGreenlandGrenadaGuamGuatemalaGuineaGuinea-BissauGuyanaHaitiHeavily indebted poor countries (HIPC)High incomeHondurasHong Kong SAR, ChinaHungaryIBRD onlyIcelandIDA & IBRD totalIDA blendIDA onlyIDA totalIndiaIndonesiaIran, Islamic Rep.IraqIrelandIsraelItalyJamaicaJapanJordanKazakhstanKenyaKiribatiKorea, Dem. People’s Rep.Korea, Rep.KuwaitKyrgyz RepublicLao PDRLate-demographic dividendLatin America & Caribbean Latin America & Caribbean (excluding high income)Latin America & the Caribbean (IDA & IBRD countries)LatviaLeast developed countries: UN classificationLebanonLesothoLiberiaLibyaLithuaniaLow & middle incomeLow incomeLower middle incomeLuxembourgMacao SAR, ChinaMacedonia, FYRMadagascarMalawiMalaysiaMaldivesMaliMaltaMarshall IslandsMauritaniaMauritiusMexicoMicronesia, Fed. Sts.Middle East & North AfricaMiddle East & North Africa (excluding high income)Middle East & North Africa (IDA & IBRD countries)Middle incomeMoldovaMongoliaMontenegroMoroccoMozambiqueMyanmarNamibiaNepalNetherlandsNew CaledoniaNew ZealandNicaraguaNigerNigeriaNorth AmericaNorthern Mariana IslandsNorwayOECD membersOmanOther small statesPacific island small statesPakistanPalauPanamaPapua New GuineaParaguayPeruPhilippinesPolandPortugalPost-demographic dividendPre-demographic dividendQatarRomaniaRussian FederationRwandaSamoaSao Tome and PrincipeSaudi ArabiaSenegalSerbiaSeychellesSierra LeoneSingaporeSint Maarten (Dutch part)Slovak RepublicSloveniaSmall statesSolomon IslandsSouth AfricaSouth AsiaSouth Asia (IDA & IBRD)SpainSri LankaSt. Kitts and NevisSt. LuciaSt. Martin (French part)St. Vincent and the GrenadinesSub-Saharan Africa Sub-Saharan Africa (excluding high income)Sub-Saharan Africa (IDA & IBRD countries)SudanSurinameSwazilandSwedenSwitzerlandSyrian Arab RepublicTajikistanTanzaniaThailandTimor-LesteTogoTongaTrinidad and TobagoTunisiaTurkeyTurkmenistanTuvaluUgandaUkraineUnited Arab EmiratesUnited KingdomUnited StatesUpper middle incomeUruguayUzbekistanVanuatuVenezuela, RBVietnamWorldYemen, Rep.ZambiaZimbabwe Timeline:
This timeline shows a graph from 1961 to 2016 of Chad. No data until 1960. Number of actual observations by date: 56.
Source name:
World Development Indicators
Source organization:
World Trade Organization.
Categories, topics:
Private Sector, Trade
Last updated:
apr 23, 2017
Indicators value changes by year
Minimum:
13.251 mln
jan 1, 1961
Maximum:
4.8 bln
jan 1, 2012
At the date of observation
Value
Absolute change
Change from previous value
jan 1, 1961
13.251 mln
+13.251 mln
0.0%
jan 1, 1962
21.442 mln
+8.191 mln
61.82%
jan 1, 1963
16.544 mln
-4.898 mln
-22.84%
jan 1, 1964
22.702 mln
+6.157 mln
37.22%
jan 1, 1965
26.51 mln
+3.808 mln
16.77%
jan 1, 1966
27.231 mln
+721.1K
2.72%
jan 1, 1967
23.69 mln
-3.541 mln
-13.0%
jan 1, 1968
30.52 mln
+6.83 mln
28.83%
jan 1, 1969
30.706 mln
+186.3K
0.61%
jan 1, 1970
31.116 mln
+409.6K
1.33%
jan 1, 1971
29.549 mln
-1.567 mln
-5.04%
jan 1, 1972
28.141 mln
-1.408 mln
-4.77%
jan 1, 1973
35.825 mln
+7.685 mln
27.31%
jan 1, 1974
38.115 mln
+2.29 mln
6.39%
jan 1, 1975
37.409 mln
-705.7K
-1.85%
jan 1, 1976
47.755 mln
+10.346 mln
27.66%
jan 1, 1977
63.328 mln
+15.573 mln
32.61%
jan 1, 1978
106.549 mln
+43.221 mln
68.25%
jan 1, 1979
98.952 mln
-7.597 mln
-7.13%
jan 1, 1980
88.266 mln
-10.686 mln
-10.8%
jan 1, 1981
71.0 mln
-17.266 mln
-19.56%
jan 1, 1982
83.0 mln
+12.0 mln
16.9%
jan 1, 1983
58.0 mln
-25.0 mln
-30.12%
jan 1, 1984
105.0 mln
+47.0 mln
81.03%
jan 1, 1985
131.0 mln
+26.0 mln
24.76%
jan 1, 1986
62.0 mln
-69.0 mln
-52.67%
jan 1, 1987
99.0 mln
+37.0 mln
59.68%
jan 1, 1988
109.0 mln
+10.0 mln
10.1%
jan 1, 1989
144.0 mln
+35.0 mln
32.11%
jan 1, 1990
155.0 mln
+11.0 mln
7.64%
jan 1, 1991
188.0 mln
+33.0 mln
21.29%
jan 1, 1992
194.0 mln
+6.0 mln
3.19%
jan 1, 1993
182.0 mln
-12.0 mln
-6.19%
jan 1, 1994
131.0 mln
-51.0 mln
-28.02%
jan 1, 1995
148.0 mln
+17.0 mln
12.98%
jan 1, 1996
243.0 mln
+95.0 mln
64.19%
jan 1, 1997
238.0 mln
-5.0 mln
-2.06%
jan 1, 1998
237.0 mln
-1000.0K
-0.42%
jan 1, 1999
262.0 mln
+25.0 mln
10.55%
jan 1, 2000
243.0 mln
-19.0 mln
-7.25%
jan 1, 2001
183.0 mln
-60.0 mln
-24.69%
jan 1, 2002
189.0 mln
+6.0 mln
3.28%
jan 1, 2003
185.0 mln
-4.0 mln
-2.12%
jan 1, 2004
601.0 mln
+416.0 mln
224.86%
jan 1, 2005
2.191 bln
+1.59 bln
264.56%
jan 1, 2006
3.081 bln
+889.945 mln
40.62%
jan 1, 2007
3.352 bln
+271.003 mln
8.8%
jan 1, 2008
3.666 bln
+314.276 mln
9.38%
jan 1, 2009
4.169 bln
+502.332 mln
13.7%
jan 1, 2010
2.8 bln
-1.369 bln
-32.83%
jan 1, 2011
3.6 bln
+800.0 mln
28.57%
jan 1, 2012
4.8 bln
+1.2 bln
33.33%
jan 1, 2013
4.8 bln
0.0
0.0%
jan 1, 2014
3.9 bln
-900.0 mln
-18.75%
jan 1, 2015
3.9 bln
0.0
0.0%
jan 1, 2016
2.9 bln
-1000.0 mln
-25.64%
Ranking of countries by current statistics by years


Comments: