29
/
en
AIzaSyAYiBZKx7MnpbEhh9jyipgxe19OcubqV5w
April 1, 2024
87510
Bolivia
BOL
true
2
1
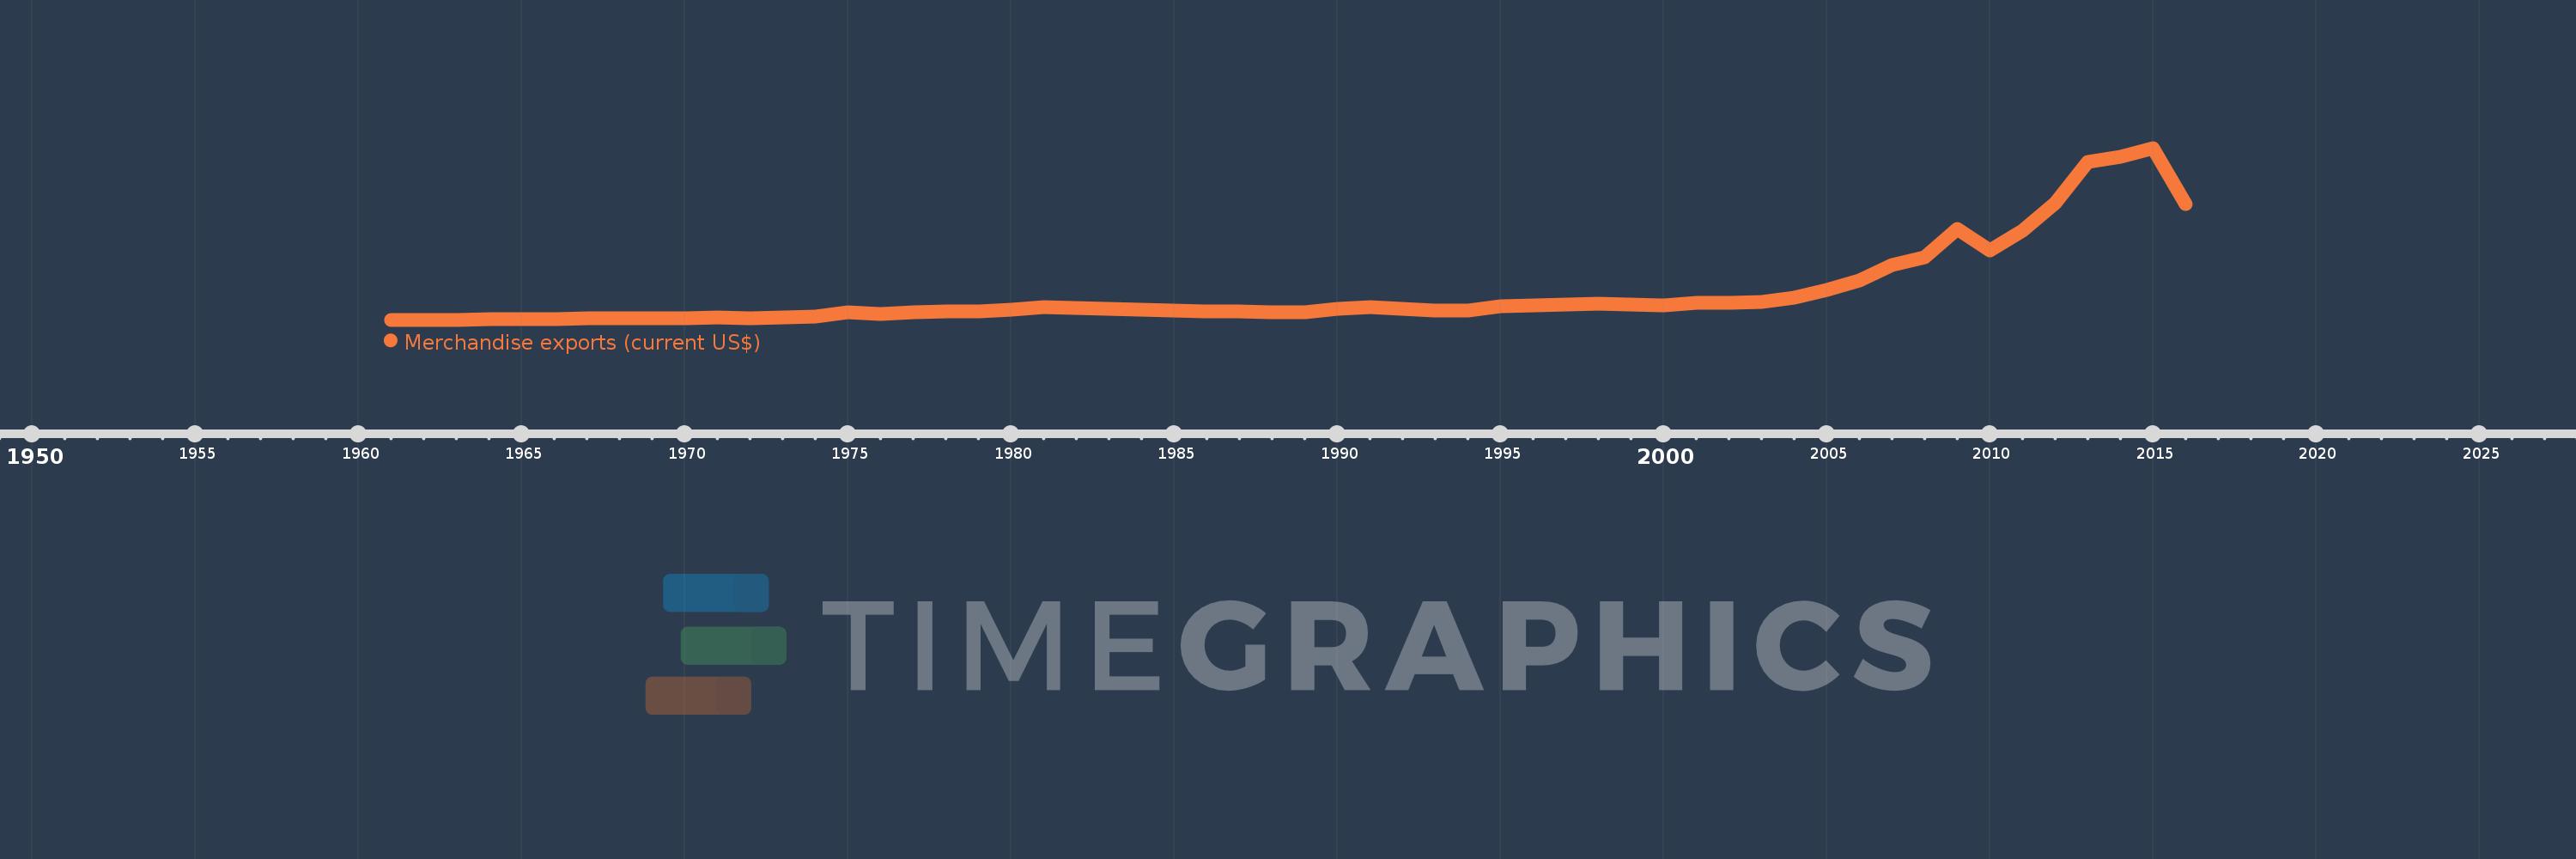
Merchandise exports (current US$)
2016,2015,2014,2013,2012,2011,2010,2009,2008,2007,2006,2005,2004,2003,2002,2001,2000,1999,1998,1997,1996,1995,1994,1993,1992,1991,1990,1989,1988,1987,1986,1985,1984,1983,1982,1981,1980,1979,1978,1977,1976,1975,1974,1973,1972,1971,1970,1969,1968,1967,1966,1965,1964,1963,1962,1961
This statistics in other country:
AfghanistanAlbaniaAlgeriaAmerican SamoaAngolaAntigua and BarbudaArab WorldArgentinaArmeniaArubaAustraliaAustriaAzerbaijanBahamas, TheBahrainBangladeshBarbadosBelarusBelgiumBelizeBeninBermudaBhutanBoliviaBosnia and HerzegovinaBotswanaBrazilBrunei DarussalamBulgariaBurkina FasoBurundiCabo VerdeCambodiaCameroonCanadaCaribbean small statesCentral African RepublicCentral Europe and the BalticsChadChileChinaColombiaComorosCongo, Dem. Rep.Congo, Rep.Costa RicaCote d'IvoireCroatiaCubaCuracaoCyprusCzech RepublicDenmarkDjiboutiDominicaDominican RepublicEarly-demographic dividendEast Asia & PacificEast Asia & Pacific (excluding high income)East Asia & Pacific (IDA & IBRD countries)EcuadorEgypt, Arab Rep.El SalvadorEquatorial GuineaEritreaEstoniaEthiopiaEuro areaEurope & Central AsiaEurope & Central Asia (excluding high income)Europe & Central Asia (IDA & IBRD countries)European UnionFaroe IslandsFijiFinlandFragile and conflict affected situationsFranceFrench PolynesiaGabonGambia, TheGeorgiaGermanyGhanaGreeceGreenlandGrenadaGuamGuatemalaGuineaGuinea-BissauGuyanaHaitiHeavily indebted poor countries (HIPC)High incomeHondurasHong Kong SAR, ChinaHungaryIBRD onlyIcelandIDA & IBRD totalIDA blendIDA onlyIDA totalIndiaIndonesiaIran, Islamic Rep.IraqIrelandIsraelItalyJamaicaJapanJordanKazakhstanKenyaKiribatiKorea, Dem. People’s Rep.Korea, Rep.KuwaitKyrgyz RepublicLao PDRLate-demographic dividendLatin America & Caribbean Latin America & Caribbean (excluding high income)Latin America & the Caribbean (IDA & IBRD countries)LatviaLeast developed countries: UN classificationLebanonLesothoLiberiaLibyaLithuaniaLow & middle incomeLow incomeLower middle incomeLuxembourgMacao SAR, ChinaMacedonia, FYRMadagascarMalawiMalaysiaMaldivesMaliMaltaMarshall IslandsMauritaniaMauritiusMexicoMicronesia, Fed. Sts.Middle East & North AfricaMiddle East & North Africa (excluding high income)Middle East & North Africa (IDA & IBRD countries)Middle incomeMoldovaMongoliaMontenegroMoroccoMozambiqueMyanmarNamibiaNepalNetherlandsNew CaledoniaNew ZealandNicaraguaNigerNigeriaNorth AmericaNorthern Mariana IslandsNorwayOECD membersOmanOther small statesPacific island small statesPakistanPalauPanamaPapua New GuineaParaguayPeruPhilippinesPolandPortugalPost-demographic dividendPre-demographic dividendQatarRomaniaRussian FederationRwandaSamoaSao Tome and PrincipeSaudi ArabiaSenegalSerbiaSeychellesSierra LeoneSingaporeSint Maarten (Dutch part)Slovak RepublicSloveniaSmall statesSolomon IslandsSouth AfricaSouth AsiaSouth Asia (IDA & IBRD)SpainSri LankaSt. Kitts and NevisSt. LuciaSt. Martin (French part)St. Vincent and the GrenadinesSub-Saharan Africa Sub-Saharan Africa (excluding high income)Sub-Saharan Africa (IDA & IBRD countries)SudanSurinameSwazilandSwedenSwitzerlandSyrian Arab RepublicTajikistanTanzaniaThailandTimor-LesteTogoTongaTrinidad and TobagoTunisiaTurkeyTurkmenistanTuvaluUgandaUkraineUnited Arab EmiratesUnited KingdomUnited StatesUpper middle incomeUruguayUzbekistanVanuatuVenezuela, RBVietnamWorldYemen, Rep.ZambiaZimbabwe Timeline:
This timeline shows a graph from 1961 to 2016 of Bolivia. No data until 1960. Number of actual observations by date: 56.
Source name:
World Development Indicators
Source organization:
World Trade Organization.
Categories, topics:
Private Sector, Trade
Last updated:
apr 23, 2017
Indicators value changes by year
Minimum:
53.0 mln
jan 1, 1961
Maximum:
12.266 bln
jan 1, 2015
At the date of observation
Value
Absolute change
Change from previous value
jan 1, 1961
53.0 mln
+53.0 mln
0.0%
jan 1, 1962
58.0 mln
+5.0 mln
9.43%
jan 1, 1963
60.0 mln
+2.0 mln
3.45%
jan 1, 1964
67.0 mln
+7.0 mln
11.67%
jan 1, 1965
96.0 mln
+29.0 mln
43.28%
jan 1, 1966
110.0 mln
+14.0 mln
14.58%
jan 1, 1967
127.4 mln
+17.4 mln
15.82%
jan 1, 1968
149.9 mln
+22.5 mln
17.66%
jan 1, 1969
152.1 mln
+2.2 mln
1.47%
jan 1, 1970
172.3 mln
+20.2 mln
13.28%
jan 1, 1971
190.2 mln
+17.9 mln
10.39%
jan 1, 1972
181.1 mln
-9.1 mln
-4.78%
jan 1, 1973
201.2 mln
+20.1 mln
11.1%
jan 1, 1974
260.5 mln
+59.3 mln
29.47%
jan 1, 1975
556.5 mln
+296.0 mln
113.63%
jan 1, 1976
444.1 mln
-112.4 mln
-20.2%
jan 1, 1977
568.2 mln
+124.1 mln
27.94%
jan 1, 1978
631.7 mln
+63.5 mln
11.18%
jan 1, 1979
628.8 mln
-2.9 mln
-0.46%
jan 1, 1980
759.8 mln
+131.0 mln
20.83%
jan 1, 1981
942.0 mln
+182.2 mln
23.98%
jan 1, 1982
912.0 mln
-30.0 mln
-3.18%
jan 1, 1983
828.0 mln
-84.0 mln
-9.21%
jan 1, 1984
755.0 mln
-73.0 mln
-8.82%
jan 1, 1985
725.0 mln
-30.0 mln
-3.97%
jan 1, 1986
623.0 mln
-102.0 mln
-14.07%
jan 1, 1987
638.0 mln
+15.0 mln
2.41%
jan 1, 1988
570.0 mln
-68.0 mln
-10.66%
jan 1, 1989
600.0 mln
+30.0 mln
5.26%
jan 1, 1990
822.0 mln
+222.0 mln
37.0%
jan 1, 1991
926.0 mln
+104.0 mln
12.65%
jan 1, 1992
849.0 mln
-77.0 mln
-8.32%
jan 1, 1993
710.0 mln
-139.0 mln
-16.37%
jan 1, 1994
728.0 mln
+18.0 mln
2.54%
jan 1, 1995
1.032 bln
+304.0 mln
41.76%
jan 1, 1996
1.1 bln
+68.0 mln
6.59%
jan 1, 1997
1.137 bln
+37.0 mln
3.36%
jan 1, 1998
1.167 bln
+30.0 mln
2.64%
jan 1, 1999
1.104 bln
-63.0 mln
-5.4%
jan 1, 2000
1.051 bln
-53.0 mln
-4.8%
jan 1, 2001
1.23 bln
+179.0 mln
17.03%
jan 1, 2002
1.285 bln
+55.0 mln
4.47%
jan 1, 2003
1.299 bln
+14.0 mln
1.09%
jan 1, 2004
1.598 bln
+298.84 mln
23.01%
jan 1, 2005
2.146 bln
+548.21 mln
34.31%
jan 1, 2006
2.827 bln
+680.667 mln
31.72%
jan 1, 2007
3.952 bln
+1.125 bln
39.79%
jan 1, 2008
4.504 bln
+552.614 mln
13.98%
jan 1, 2009
6.525 bln
+2.021 bln
44.87%
jan 1, 2010
4.96 bln
-1.565 bln
-23.98%
jan 1, 2011
6.402 bln
+1.442 bln
29.06%
jan 1, 2012
8.358 bln
+1.956 bln
30.56%
jan 1, 2013
11.254 bln
+2.896 bln
34.65%
jan 1, 2014
11.657 bln
+402.717 mln
3.58%
jan 1, 2015
12.266 bln
+609.177 mln
5.23%
jan 1, 2016
8.261 bln
-4.005 bln
-32.65%
Ranking of countries by current statistics by years


Comments: