29
/
en
AIzaSyAYiBZKx7MnpbEhh9jyipgxe19OcubqV5w
April 1, 2024
226153
Portugal
PRT
true
2
1
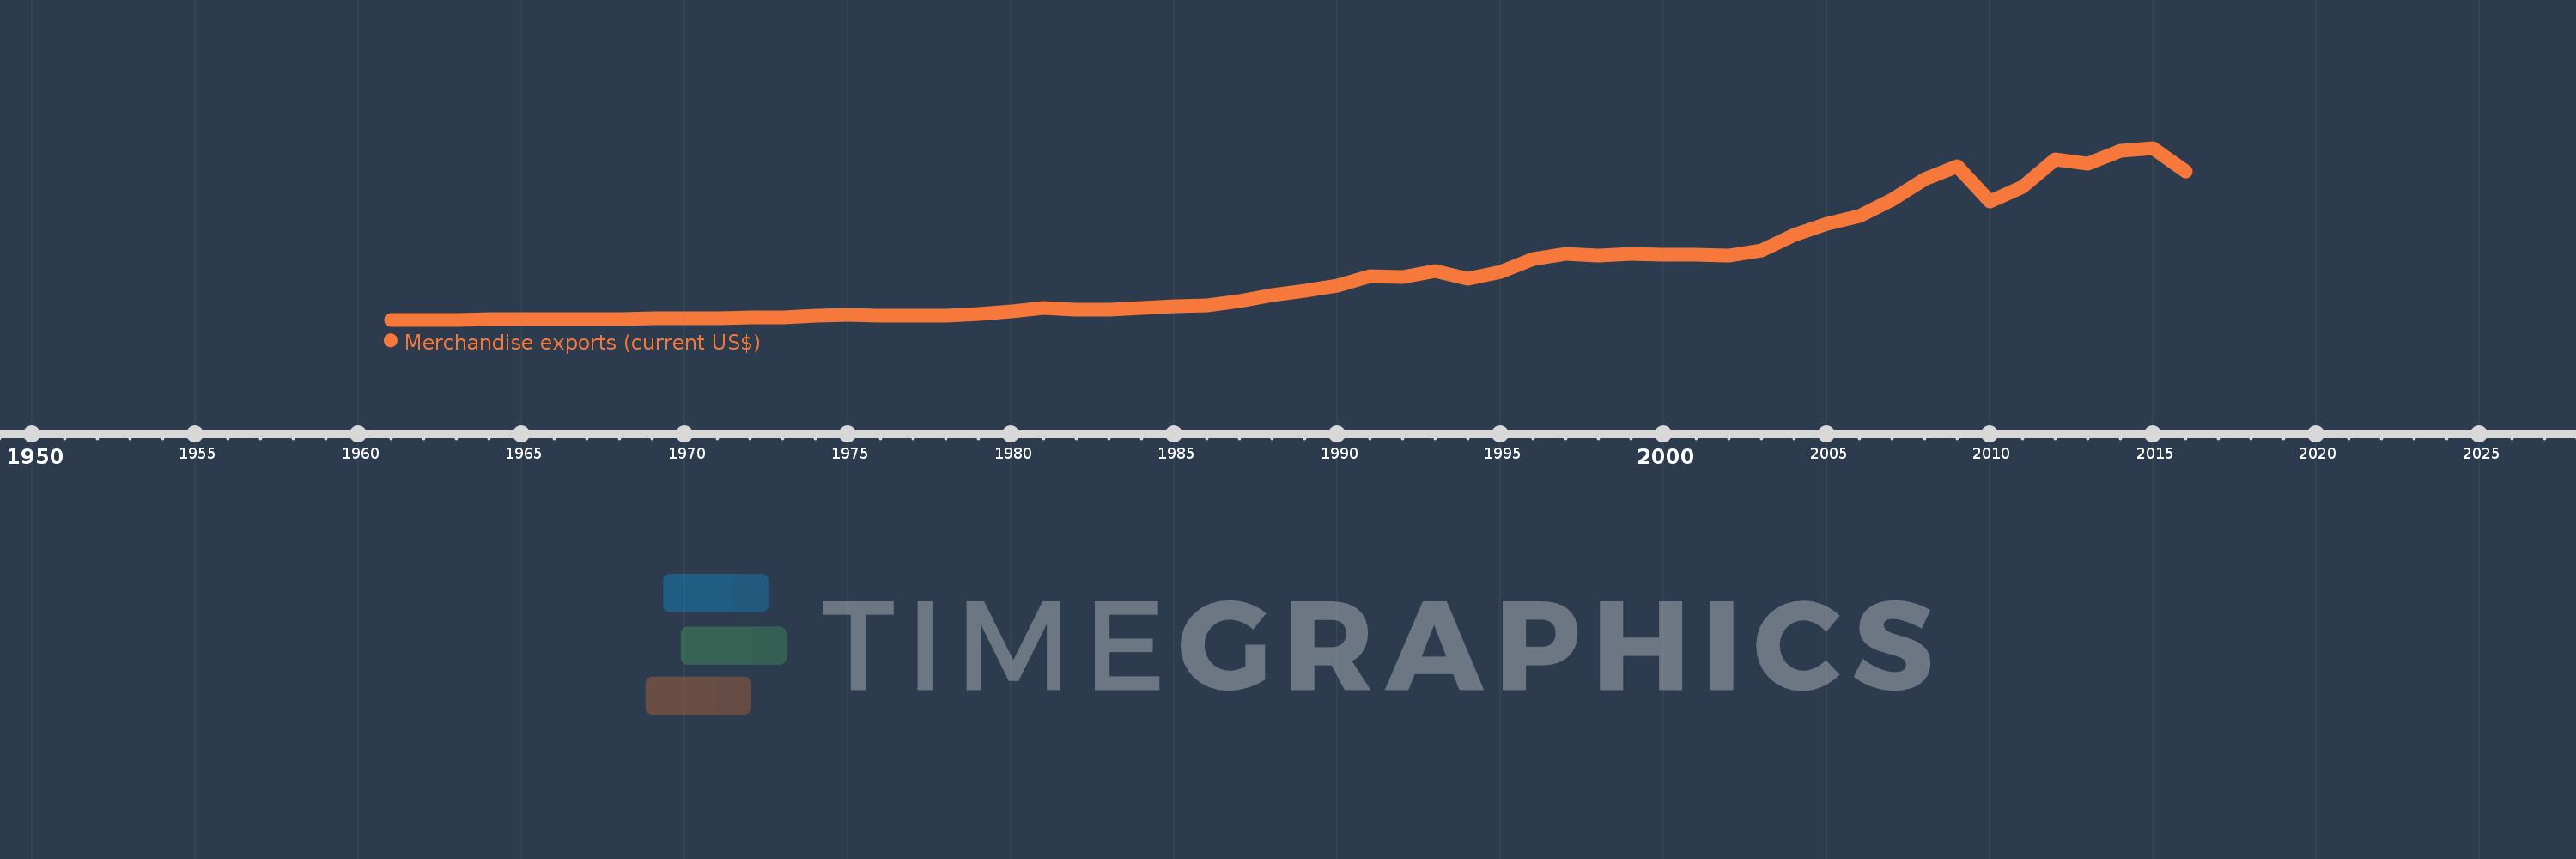
Merchandise exports (current US$)
2016,2015,2014,2013,2012,2011,2010,2009,2008,2007,2006,2005,2004,2003,2002,2001,2000,1999,1998,1997,1996,1995,1994,1993,1992,1991,1990,1989,1988,1987,1986,1985,1984,1983,1982,1981,1980,1979,1978,1977,1976,1975,1974,1973,1972,1971,1970,1969,1968,1967,1966,1965,1964,1963,1962,1961
This statistics in other country:
AfghanistanAlbaniaAlgeriaAmerican SamoaAngolaAntigua and BarbudaArab WorldArgentinaArmeniaArubaAustraliaAustriaAzerbaijanBahamas, TheBahrainBangladeshBarbadosBelarusBelgiumBelizeBeninBermudaBhutanBoliviaBosnia and HerzegovinaBotswanaBrazilBrunei DarussalamBulgariaBurkina FasoBurundiCabo VerdeCambodiaCameroonCanadaCaribbean small statesCentral African RepublicCentral Europe and the BalticsChadChileChinaColombiaComorosCongo, Dem. Rep.Congo, Rep.Costa RicaCote d'IvoireCroatiaCubaCuracaoCyprusCzech RepublicDenmarkDjiboutiDominicaDominican RepublicEarly-demographic dividendEast Asia & PacificEast Asia & Pacific (excluding high income)East Asia & Pacific (IDA & IBRD countries)EcuadorEgypt, Arab Rep.El SalvadorEquatorial GuineaEritreaEstoniaEthiopiaEuro areaEurope & Central AsiaEurope & Central Asia (excluding high income)Europe & Central Asia (IDA & IBRD countries)European UnionFaroe IslandsFijiFinlandFragile and conflict affected situationsFranceFrench PolynesiaGabonGambia, TheGeorgiaGermanyGhanaGreeceGreenlandGrenadaGuamGuatemalaGuineaGuinea-BissauGuyanaHaitiHeavily indebted poor countries (HIPC)High incomeHondurasHong Kong SAR, ChinaHungaryIBRD onlyIcelandIDA & IBRD totalIDA blendIDA onlyIDA totalIndiaIndonesiaIran, Islamic Rep.IraqIrelandIsraelItalyJamaicaJapanJordanKazakhstanKenyaKiribatiKorea, Dem. People’s Rep.Korea, Rep.KuwaitKyrgyz RepublicLao PDRLate-demographic dividendLatin America & Caribbean Latin America & Caribbean (excluding high income)Latin America & the Caribbean (IDA & IBRD countries)LatviaLeast developed countries: UN classificationLebanonLesothoLiberiaLibyaLithuaniaLow & middle incomeLow incomeLower middle incomeLuxembourgMacao SAR, ChinaMacedonia, FYRMadagascarMalawiMalaysiaMaldivesMaliMaltaMarshall IslandsMauritaniaMauritiusMexicoMicronesia, Fed. Sts.Middle East & North AfricaMiddle East & North Africa (excluding high income)Middle East & North Africa (IDA & IBRD countries)Middle incomeMoldovaMongoliaMontenegroMoroccoMozambiqueMyanmarNamibiaNepalNetherlandsNew CaledoniaNew ZealandNicaraguaNigerNigeriaNorth AmericaNorthern Mariana IslandsNorwayOECD membersOmanOther small statesPacific island small statesPakistanPalauPanamaPapua New GuineaParaguayPeruPhilippinesPolandPortugalPost-demographic dividendPre-demographic dividendQatarRomaniaRussian FederationRwandaSamoaSao Tome and PrincipeSaudi ArabiaSenegalSerbiaSeychellesSierra LeoneSingaporeSint Maarten (Dutch part)Slovak RepublicSloveniaSmall statesSolomon IslandsSouth AfricaSouth AsiaSouth Asia (IDA & IBRD)SpainSri LankaSt. Kitts and NevisSt. LuciaSt. Martin (French part)St. Vincent and the GrenadinesSub-Saharan Africa Sub-Saharan Africa (excluding high income)Sub-Saharan Africa (IDA & IBRD countries)SudanSurinameSwazilandSwedenSwitzerlandSyrian Arab RepublicTajikistanTanzaniaThailandTimor-LesteTogoTongaTrinidad and TobagoTunisiaTurkeyTurkmenistanTuvaluUgandaUkraineUnited Arab EmiratesUnited KingdomUnited StatesUpper middle incomeUruguayUzbekistanVanuatuVenezuela, RBVietnamWorldYemen, Rep.ZambiaZimbabwe Timeline:
This timeline shows a graph from 1961 to 2016 of Portugal. No data until 1960. Number of actual observations by date: 56.
Source name:
World Development Indicators
Source organization:
World Trade Organization.
Categories, topics:
Private Sector, Trade
Last updated:
apr 23, 2017
Indicators value changes by year
Minimum:
325.913 mln
jan 1, 1961
Maximum:
63.907 bln
jan 1, 2015
At the date of observation
Value
Absolute change
Change from previous value
jan 1, 1961
325.913 mln
+325.913 mln
0.0%
jan 1, 1962
331.165 mln
+5.252 mln
1.61%
jan 1, 1963
370.261 mln
+39.096 mln
11.81%
jan 1, 1964
417.496 mln
+47.235 mln
12.76%
jan 1, 1965
517.67 mln
+100.174 mln
23.99%
jan 1, 1966
583.617 mln
+65.947 mln
12.74%
jan 1, 1967
627.304 mln
+43.687 mln
7.49%
jan 1, 1968
695.652 mln
+68.348 mln
10.9%
jan 1, 1969
733.913 mln
+38.261 mln
5.5%
jan 1, 1970
822.748 mln
+88.835 mln
12.1%
jan 1, 1971
945.774 mln
+123.026 mln
14.95%
jan 1, 1972
1.049 bln
+103.566 mln
10.95%
jan 1, 1973
1.298 bln
+248.58 mln
23.69%
jan 1, 1974
1.842 bln
+544.03 mln
41.92%
jan 1, 1975
2.277 bln
+434.61 mln
23.6%
jan 1, 1976
1.939 bln
-337.24 mln
-14.81%
jan 1, 1977
1.811 bln
-128.73 mln
-6.64%
jan 1, 1978
1.97 bln
+159.65 mln
8.82%
jan 1, 1979
2.414 bln
+444.07 mln
22.54%
jan 1, 1980
3.479 bln
+1.065 bln
44.12%
jan 1, 1981
4.64 bln
+1.161 bln
33.35%
jan 1, 1982
4.148 bln
-492.0 mln
-10.6%
jan 1, 1983
4.164 bln
+16.0 mln
0.39%
jan 1, 1984
4.599 bln
+435.0 mln
10.45%
jan 1, 1985
5.2 bln
+601.0 mln
13.07%
jan 1, 1986
5.685 bln
+485.0 mln
9.33%
jan 1, 1987
7.242 bln
+1.557 bln
27.39%
jan 1, 1988
9.32 bln
+2.078 bln
28.69%
jan 1, 1989
10.989 bln
+1.669 bln
17.91%
jan 1, 1990
12.799 bln
+1.81 bln
16.47%
jan 1, 1991
16.417 bln
+3.618 bln
28.27%
jan 1, 1992
16.28 bln
-137.0 mln
-0.83%
jan 1, 1993
18.35 bln
+2.07 bln
12.71%
jan 1, 1994
15.428 bln
-2.922 bln
-15.92%
jan 1, 1995
17.989 bln
+2.561 bln
16.6%
jan 1, 1996
22.783 bln
+4.794 bln
26.65%
jan 1, 1997
24.618 bln
+1.835 bln
8.05%
jan 1, 1998
23.955 bln
-663.0 mln
-2.69%
jan 1, 1999
24.793 bln
+838.219 mln
3.5%
jan 1, 2000
24.541 bln
-252.204 mln
-1.02%
jan 1, 2001
24.363 bln
-177.59 mln
-0.72%
jan 1, 2002
24.108 bln
-255.378 mln
-1.05%
jan 1, 2003
25.908 bln
+1.8 bln
7.47%
jan 1, 2004
31.757 bln
+5.85 bln
22.58%
jan 1, 2005
35.787 bln
+4.029 bln
12.69%
jan 1, 2006
38.738 bln
+2.951 bln
8.25%
jan 1, 2007
44.75 bln
+6.013 bln
15.52%
jan 1, 2008
52.482 bln
+7.732 bln
17.28%
jan 1, 2009
57.137 bln
+4.655 bln
8.87%
jan 1, 2010
44.211 bln
-12.926 bln
-22.62%
jan 1, 2011
49.406 bln
+5.195 bln
11.75%
jan 1, 2012
59.617 bln
+10.211 bln
20.67%
jan 1, 2013
58.09 bln
-1.527 bln
-2.56%
jan 1, 2014
62.823 bln
+4.733 bln
8.15%
jan 1, 2015
63.907 bln
+1.084 bln
1.73%
jan 1, 2016
55.271 bln
-8.636 bln
-13.51%
Ranking of countries by current statistics by years


Comments: