29
/
en
AIzaSyAYiBZKx7MnpbEhh9jyipgxe19OcubqV5w
April 1, 2024
37538
IDA & IBRD total
IBT
false
2
1
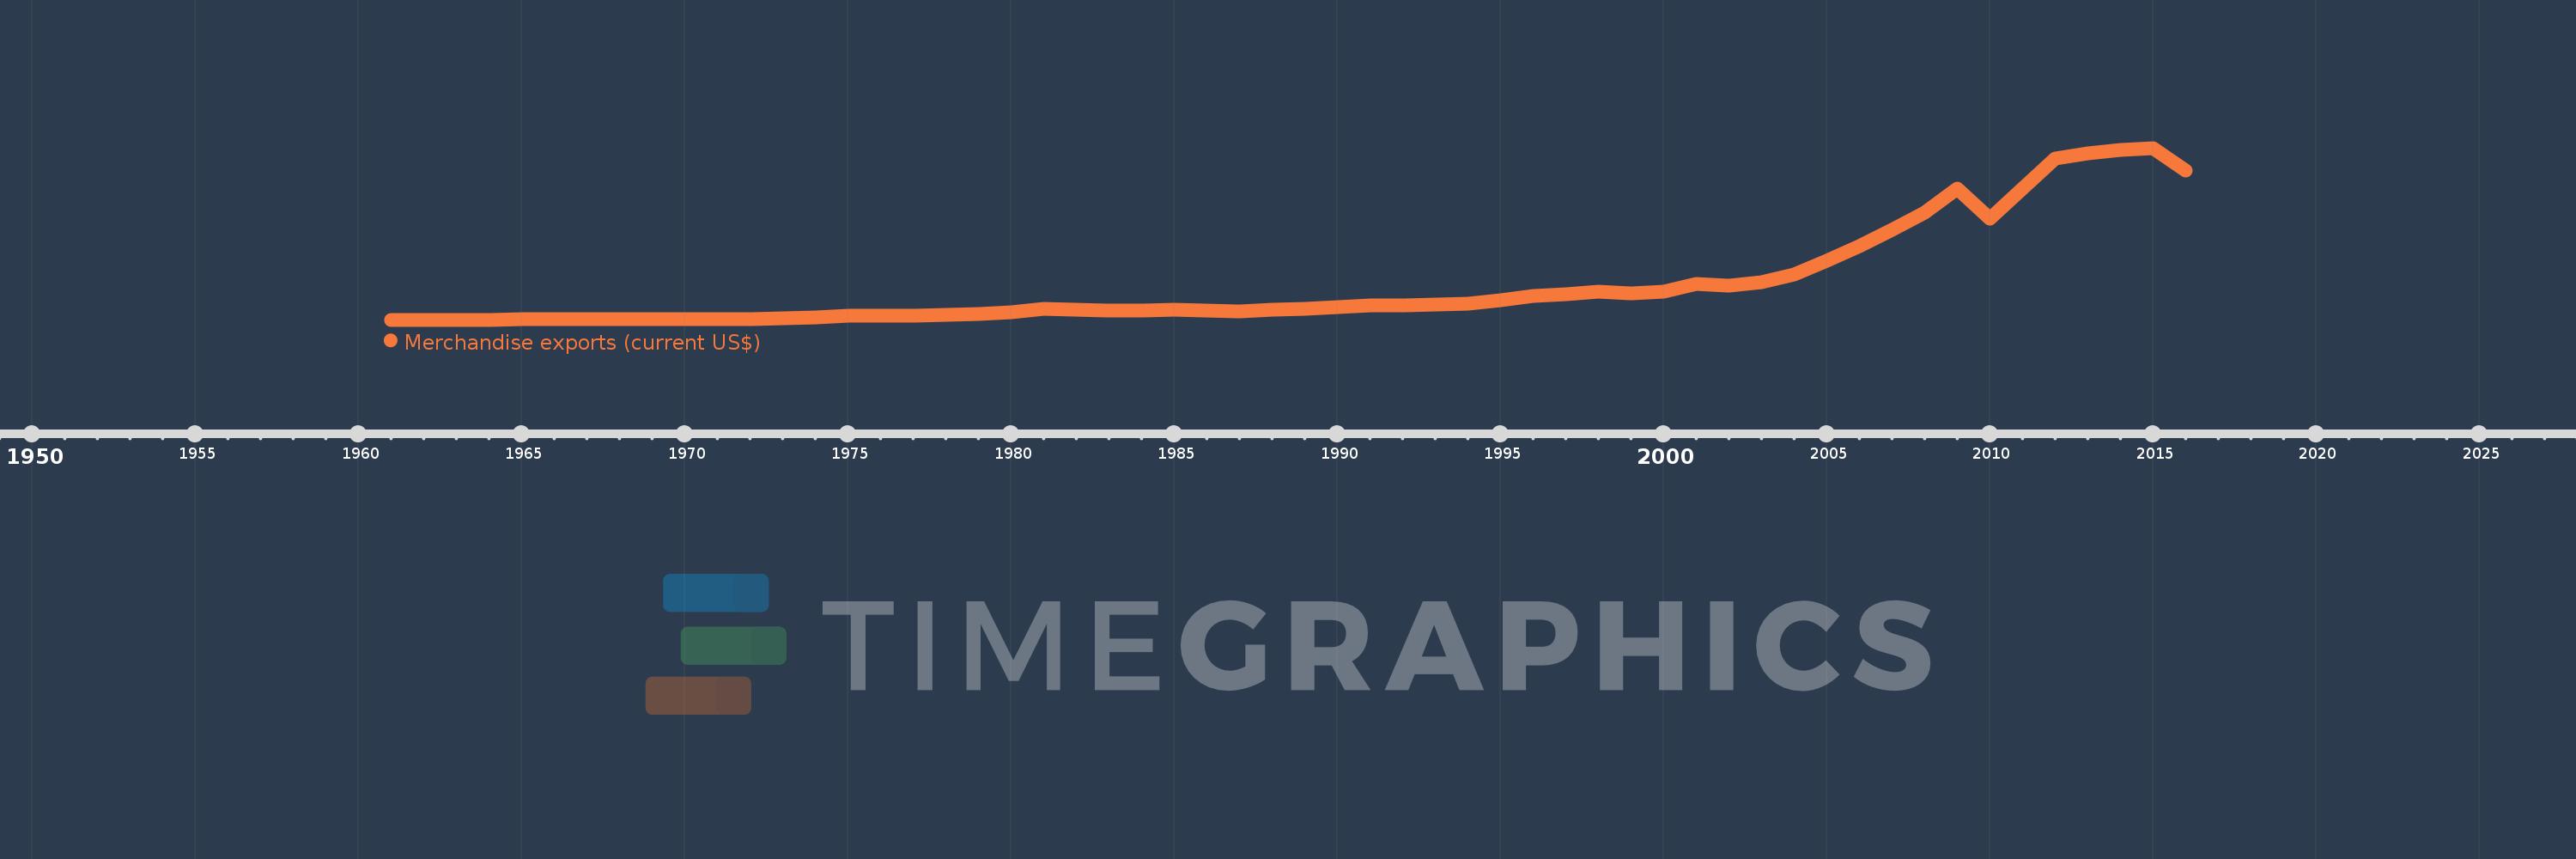
Merchandise exports (current US$)
2016,2015,2014,2013,2012,2011,2010,2009,2008,2007,2006,2005,2004,2003,2002,2001,2000,1999,1998,1997,1996,1995,1994,1993,1992,1991,1990,1989,1988,1987,1986,1985,1984,1983,1982,1981,1980,1979,1978,1977,1976,1975,1974,1973,1972,1971,1970,1969,1968,1967,1966,1965,1964,1963,1962,1961
This statistics in other country:
AfghanistanAlbaniaAlgeriaAmerican SamoaAngolaAntigua and BarbudaArab WorldArgentinaArmeniaArubaAustraliaAustriaAzerbaijanBahamas, TheBahrainBangladeshBarbadosBelarusBelgiumBelizeBeninBermudaBhutanBoliviaBosnia and HerzegovinaBotswanaBrazilBrunei DarussalamBulgariaBurkina FasoBurundiCabo VerdeCambodiaCameroonCanadaCaribbean small statesCentral African RepublicCentral Europe and the BalticsChadChileChinaColombiaComorosCongo, Dem. Rep.Congo, Rep.Costa RicaCote d'IvoireCroatiaCubaCuracaoCyprusCzech RepublicDenmarkDjiboutiDominicaDominican RepublicEarly-demographic dividendEast Asia & PacificEast Asia & Pacific (excluding high income)East Asia & Pacific (IDA & IBRD countries)EcuadorEgypt, Arab Rep.El SalvadorEquatorial GuineaEritreaEstoniaEthiopiaEuro areaEurope & Central AsiaEurope & Central Asia (excluding high income)Europe & Central Asia (IDA & IBRD countries)European UnionFaroe IslandsFijiFinlandFragile and conflict affected situationsFranceFrench PolynesiaGabonGambia, TheGeorgiaGermanyGhanaGreeceGreenlandGrenadaGuamGuatemalaGuineaGuinea-BissauGuyanaHaitiHeavily indebted poor countries (HIPC)High incomeHondurasHong Kong SAR, ChinaHungaryIBRD onlyIcelandIDA & IBRD totalIDA blendIDA onlyIDA totalIndiaIndonesiaIran, Islamic Rep.IraqIrelandIsraelItalyJamaicaJapanJordanKazakhstanKenyaKiribatiKorea, Dem. People’s Rep.Korea, Rep.KuwaitKyrgyz RepublicLao PDRLate-demographic dividendLatin America & Caribbean Latin America & Caribbean (excluding high income)Latin America & the Caribbean (IDA & IBRD countries)LatviaLeast developed countries: UN classificationLebanonLesothoLiberiaLibyaLithuaniaLow & middle incomeLow incomeLower middle incomeLuxembourgMacao SAR, ChinaMacedonia, FYRMadagascarMalawiMalaysiaMaldivesMaliMaltaMarshall IslandsMauritaniaMauritiusMexicoMicronesia, Fed. Sts.Middle East & North AfricaMiddle East & North Africa (excluding high income)Middle East & North Africa (IDA & IBRD countries)Middle incomeMoldovaMongoliaMontenegroMoroccoMozambiqueMyanmarNamibiaNepalNetherlandsNew CaledoniaNew ZealandNicaraguaNigerNigeriaNorth AmericaNorthern Mariana IslandsNorwayOECD membersOmanOther small statesPacific island small statesPakistanPalauPanamaPapua New GuineaParaguayPeruPhilippinesPolandPortugalPost-demographic dividendPre-demographic dividendQatarRomaniaRussian FederationRwandaSamoaSao Tome and PrincipeSaudi ArabiaSenegalSerbiaSeychellesSierra LeoneSingaporeSint Maarten (Dutch part)Slovak RepublicSloveniaSmall statesSolomon IslandsSouth AfricaSouth AsiaSouth Asia (IDA & IBRD)SpainSri LankaSt. Kitts and NevisSt. LuciaSt. Martin (French part)St. Vincent and the GrenadinesSub-Saharan Africa Sub-Saharan Africa (excluding high income)Sub-Saharan Africa (IDA & IBRD countries)SudanSurinameSwazilandSwedenSwitzerlandSyrian Arab RepublicTajikistanTanzaniaThailandTimor-LesteTogoTongaTrinidad and TobagoTunisiaTurkeyTurkmenistanTuvaluUgandaUkraineUnited Arab EmiratesUnited KingdomUnited StatesUpper middle incomeUruguayUzbekistanVanuatuVenezuela, RBVietnamWorldYemen, Rep.ZambiaZimbabwe Timeline:
This timeline shows a graph from 1961 to 2016 of IDA & IBRD total. No data until 1960. Number of actual observations by date: 56.
Source name:
World Development Indicators
Source organization:
World Trade Organization.
Categories, topics:
Private Sector, Trade
Last updated:
apr 23, 2017
Indicators value changes by year
Minimum:
32.701 bln
jan 1, 1962
Maximum:
6.712 trl
jan 1, 2015
At the date of observation
Value
Absolute change
Change from previous value
jan 1, 1961
32.724 bln
+32.724 bln
0.0%
jan 1, 1962
32.701 bln
-22.945 mln
-0.07%
jan 1, 1963
33.607 bln
+905.113 mln
2.77%
jan 1, 1964
37.44 bln
+3.834 bln
11.41%
jan 1, 1965
41.41 bln
+3.969 bln
10.6%
jan 1, 1966
43.76 bln
+2.35 bln
5.68%
jan 1, 1967
46.365 bln
+2.605 bln
5.95%
jan 1, 1968
47.994 bln
+1.63 bln
3.51%
jan 1, 1969
50.937 bln
+2.942 bln
6.13%
jan 1, 1970
56.658 bln
+5.721 bln
11.23%
jan 1, 1971
62.049 bln
+5.391 bln
9.52%
jan 1, 1972
67.216 bln
+5.167 bln
8.33%
jan 1, 1973
76.309 bln
+9.093 bln
13.53%
jan 1, 1974
108.206 bln
+31.897 bln
41.8%
jan 1, 1975
180.566 bln
+72.359 bln
66.87%
jan 1, 1976
175.858 bln
-4.708 bln
-2.61%
jan 1, 1977
200.31 bln
+24.453 bln
13.9%
jan 1, 1978
229.004 bln
+28.694 bln
14.32%
jan 1, 1979
247.134 bln
+18.13 bln
7.92%
jan 1, 1980
337.247 bln
+90.113 bln
36.46%
jan 1, 1981
440.96 bln
+103.713 bln
30.75%
jan 1, 1982
408.732 bln
-32.228 bln
-7.31%
jan 1, 1983
388.018 bln
-20.715 bln
-5.07%
jan 1, 1984
386.834 bln
-1.184 bln
-0.31%
jan 1, 1985
410.795 bln
+23.961 bln
6.19%
jan 1, 1986
399.106 bln
-11.689 bln
-2.85%
jan 1, 1987
355.559 bln
-43.547 bln
-10.91%
jan 1, 1988
419.14 bln
+63.581 bln
17.88%
jan 1, 1989
471.105 bln
+51.966 bln
12.4%
jan 1, 1990
526.319 bln
+55.213 bln
11.72%
jan 1, 1991
575.983 bln
+49.665 bln
9.44%
jan 1, 1992
580.696 bln
+4.713 bln
0.82%
jan 1, 1993
629.895 bln
+49.2 bln
8.47%
jan 1, 1994
664.814 bln
+34.919 bln
5.54%
jan 1, 1995
778.52 bln
+113.705 bln
17.1%
jan 1, 1996
943.893 bln
+165.373 bln
21.24%
jan 1, 1997
1.026 trl
+82.122 bln
8.7%
jan 1, 1998
1.112 trl
+86.21 bln
8.4%
jan 1, 1999
1.055 trl
-56.933 bln
-5.12%
jan 1, 2000
1.136 trl
+80.256 bln
7.61%
jan 1, 2001
1.409 trl
+273.453 bln
24.08%
jan 1, 2002
1.371 trl
-37.509 bln
-2.66%
jan 1, 2003
1.488 trl
+116.193 bln
8.47%
jan 1, 2004
1.795 trl
+307.706 bln
20.68%
jan 1, 2005
2.317 trl
+521.543 bln
29.05%
jan 1, 2006
2.882 trl
+565.323 bln
24.4%
jan 1, 2007
3.524 trl
+641.378 bln
22.25%
jan 1, 2008
4.212 trl
+688.061 bln
19.53%
jan 1, 2009
5.116 trl
+904.264 bln
21.47%
jan 1, 2010
3.973 trl
-1.143 trl
-22.35%
jan 1, 2011
5.122 trl
+1.149 trl
28.92%
jan 1, 2012
6.303 trl
+1.181 trl
23.07%
jan 1, 2013
6.499 trl
+195.768 bln
3.11%
jan 1, 2014
6.64 trl
+141.067 bln
2.17%
jan 1, 2015
6.712 trl
+72.214 bln
1.09%
jan 1, 2016
5.834 trl
-877.856 bln
-13.08%
Ranking of countries by current statistics by years


Comments: