29
/
en
AIzaSyAYiBZKx7MnpbEhh9jyipgxe19OcubqV5w
April 1, 2024
216705
Pakistan
PAK
true
2
1
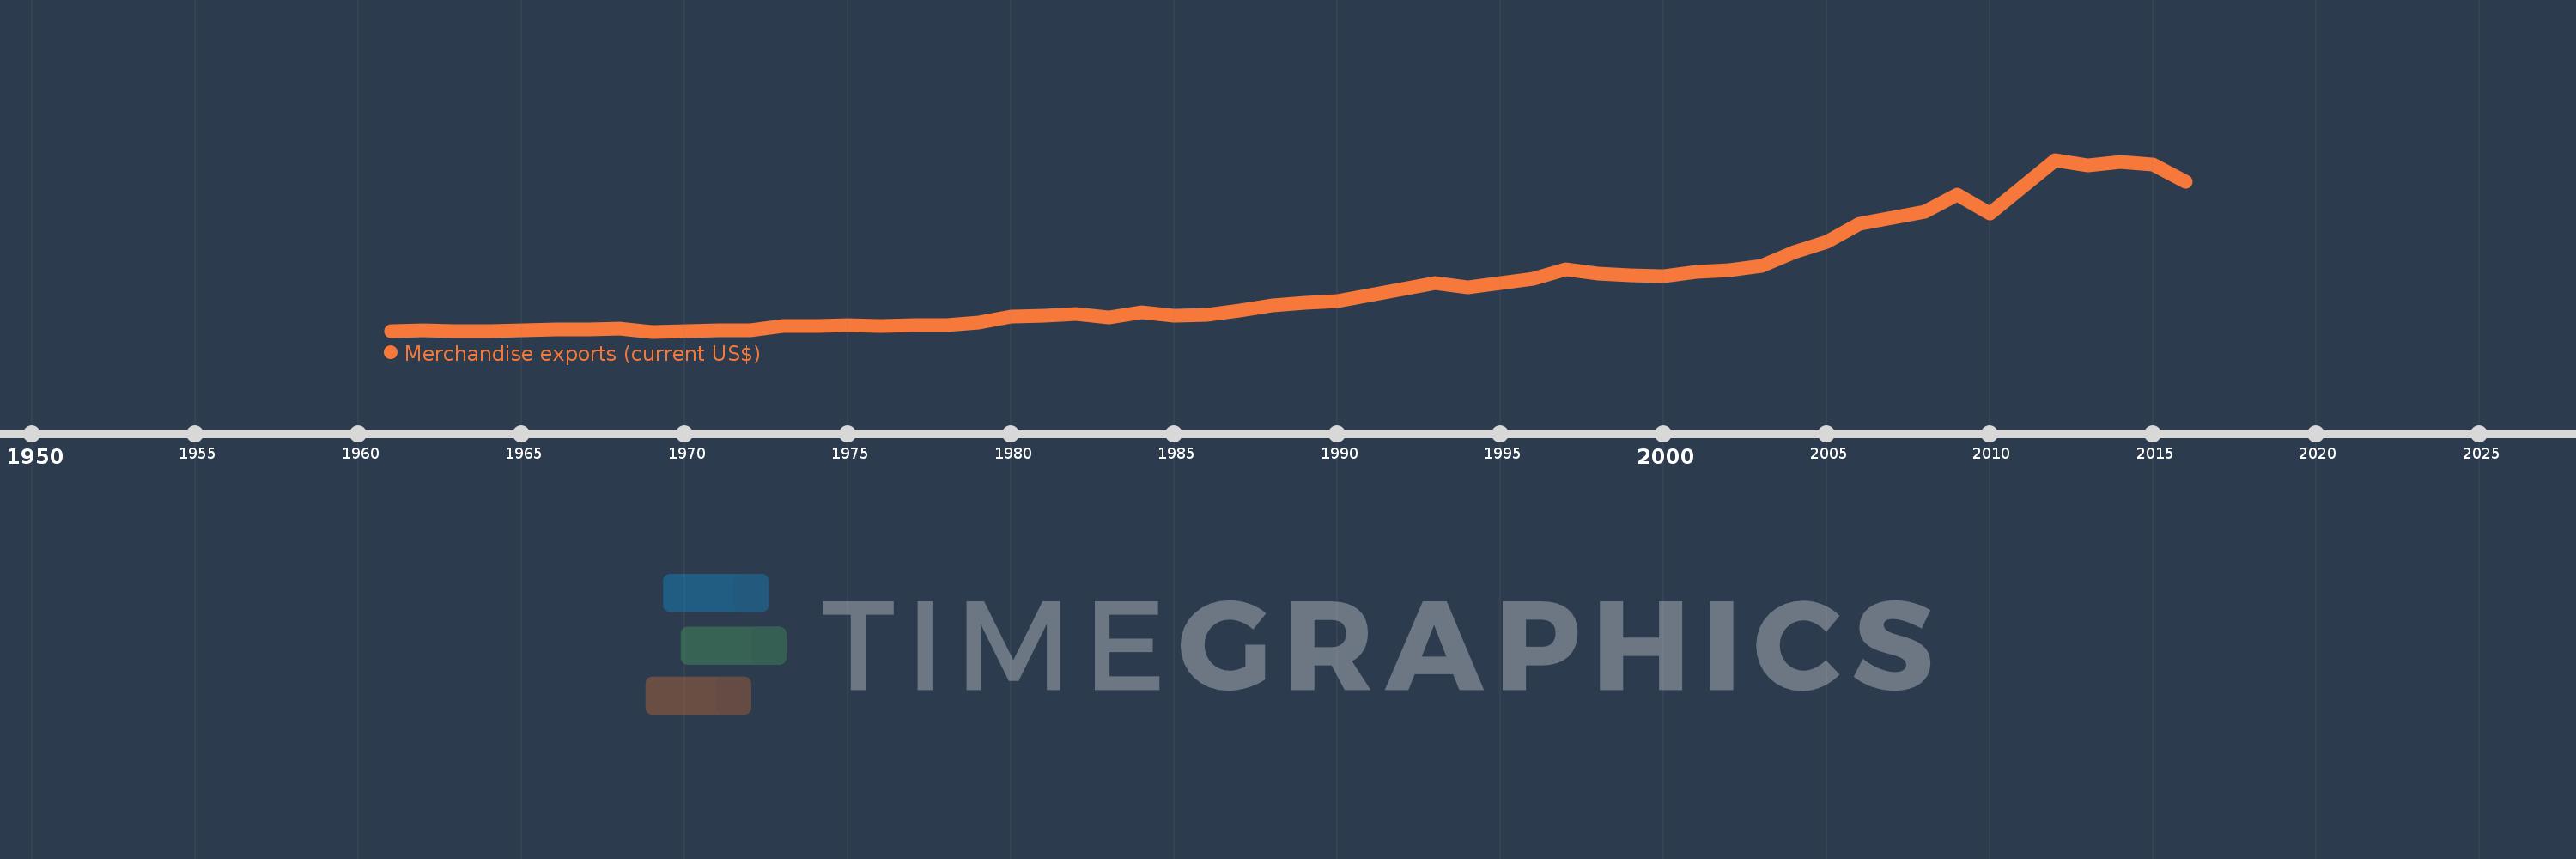
Merchandise exports (current US$)
2016,2015,2014,2013,2012,2011,2010,2009,2008,2007,2006,2005,2004,2003,2002,2001,2000,1999,1998,1997,1996,1995,1994,1993,1992,1991,1990,1989,1988,1987,1986,1985,1984,1983,1982,1981,1980,1979,1978,1977,1976,1975,1974,1973,1972,1971,1970,1969,1968,1967,1966,1965,1964,1963,1962,1961
This statistics in other country:
AfghanistanAlbaniaAlgeriaAmerican SamoaAngolaAntigua and BarbudaArab WorldArgentinaArmeniaArubaAustraliaAustriaAzerbaijanBahamas, TheBahrainBangladeshBarbadosBelarusBelgiumBelizeBeninBermudaBhutanBoliviaBosnia and HerzegovinaBotswanaBrazilBrunei DarussalamBulgariaBurkina FasoBurundiCabo VerdeCambodiaCameroonCanadaCaribbean small statesCentral African RepublicCentral Europe and the BalticsChadChileChinaColombiaComorosCongo, Dem. Rep.Congo, Rep.Costa RicaCote d'IvoireCroatiaCubaCuracaoCyprusCzech RepublicDenmarkDjiboutiDominicaDominican RepublicEarly-demographic dividendEast Asia & PacificEast Asia & Pacific (excluding high income)East Asia & Pacific (IDA & IBRD countries)EcuadorEgypt, Arab Rep.El SalvadorEquatorial GuineaEritreaEstoniaEthiopiaEuro areaEurope & Central AsiaEurope & Central Asia (excluding high income)Europe & Central Asia (IDA & IBRD countries)European UnionFaroe IslandsFijiFinlandFragile and conflict affected situationsFranceFrench PolynesiaGabonGambia, TheGeorgiaGermanyGhanaGreeceGreenlandGrenadaGuamGuatemalaGuineaGuinea-BissauGuyanaHaitiHeavily indebted poor countries (HIPC)High incomeHondurasHong Kong SAR, ChinaHungaryIBRD onlyIcelandIDA & IBRD totalIDA blendIDA onlyIDA totalIndiaIndonesiaIran, Islamic Rep.IraqIrelandIsraelItalyJamaicaJapanJordanKazakhstanKenyaKiribatiKorea, Dem. People’s Rep.Korea, Rep.KuwaitKyrgyz RepublicLao PDRLate-demographic dividendLatin America & Caribbean Latin America & Caribbean (excluding high income)Latin America & the Caribbean (IDA & IBRD countries)LatviaLeast developed countries: UN classificationLebanonLesothoLiberiaLibyaLithuaniaLow & middle incomeLow incomeLower middle incomeLuxembourgMacao SAR, ChinaMacedonia, FYRMadagascarMalawiMalaysiaMaldivesMaliMaltaMarshall IslandsMauritaniaMauritiusMexicoMicronesia, Fed. Sts.Middle East & North AfricaMiddle East & North Africa (excluding high income)Middle East & North Africa (IDA & IBRD countries)Middle incomeMoldovaMongoliaMontenegroMoroccoMozambiqueMyanmarNamibiaNepalNetherlandsNew CaledoniaNew ZealandNicaraguaNigerNigeriaNorth AmericaNorthern Mariana IslandsNorwayOECD membersOmanOther small statesPacific island small statesPakistanPalauPanamaPapua New GuineaParaguayPeruPhilippinesPolandPortugalPost-demographic dividendPre-demographic dividendQatarRomaniaRussian FederationRwandaSamoaSao Tome and PrincipeSaudi ArabiaSenegalSerbiaSeychellesSierra LeoneSingaporeSint Maarten (Dutch part)Slovak RepublicSloveniaSmall statesSolomon IslandsSouth AfricaSouth AsiaSouth Asia (IDA & IBRD)SpainSri LankaSt. Kitts and NevisSt. LuciaSt. Martin (French part)St. Vincent and the GrenadinesSub-Saharan Africa Sub-Saharan Africa (excluding high income)Sub-Saharan Africa (IDA & IBRD countries)SudanSurinameSwazilandSwedenSwitzerlandSyrian Arab RepublicTajikistanTanzaniaThailandTimor-LesteTogoTongaTrinidad and TobagoTunisiaTurkeyTurkmenistanTuvaluUgandaUkraineUnited Arab EmiratesUnited KingdomUnited StatesUpper middle incomeUruguayUzbekistanVanuatuVenezuela, RBVietnamWorldYemen, Rep.ZambiaZimbabwe Timeline:
This timeline shows a graph from 1961 to 2016 of Pakistan. No data until 1960. Number of actual observations by date: 56.
Source name:
World Development Indicators
Source organization:
World Trade Organization.
Categories, topics:
Private Sector, Trade
Last updated:
apr 23, 2017
Indicators value changes by year
Minimum:
292.062 mln
jan 1, 1969
Maximum:
25.383 bln
jan 1, 2012
At the date of observation
Value
Absolute change
Change from previous value
jan 1, 1961
400.16 mln
+400.16 mln
0.0%
jan 1, 1962
424.067 mln
+23.907 mln
5.97%
jan 1, 1963
406.571 mln
-17.496 mln
-4.13%
jan 1, 1964
406.608 mln
+37.0K
0.01%
jan 1, 1965
469.324 mln
+62.716 mln
15.42%
jan 1, 1966
550.458 mln
+81.134 mln
17.29%
jan 1, 1967
634.119 mln
+83.661 mln
15.2%
jan 1, 1968
679.89 mln
+45.771 mln
7.22%
jan 1, 1969
292.062 mln
-387.828 mln
-57.04%
jan 1, 1970
331.614 mln
+39.552 mln
13.54%
jan 1, 1971
448.526 mln
+116.912 mln
35.26%
jan 1, 1972
491.675 mln
+43.149 mln
9.62%
jan 1, 1973
1.169 bln
+677.745 mln
137.84%
jan 1, 1974
1.06 bln
-109.53 mln
-9.37%
jan 1, 1975
1.193 bln
+133.0 mln
12.55%
jan 1, 1976
1.053 bln
-140.37 mln
-11.77%
jan 1, 1977
1.186 bln
+133.41 mln
12.68%
jan 1, 1978
1.213 bln
+26.61 mln
2.24%
jan 1, 1979
1.634 bln
+421.54 mln
34.77%
jan 1, 1980
2.462 bln
+827.72 mln
50.65%
jan 1, 1981
2.618 bln
+156.2 mln
6.34%
jan 1, 1982
2.883 bln
+265.0 mln
10.12%
jan 1, 1983
2.397 bln
-486.0 mln
-16.86%
jan 1, 1984
3.077 bln
+680.0 mln
28.37%
jan 1, 1985
2.558 bln
-519.0 mln
-16.87%
jan 1, 1986
2.74 bln
+182.0 mln
7.11%
jan 1, 1987
3.384 bln
+644.0 mln
23.5%
jan 1, 1988
4.172 bln
+788.0 mln
23.29%
jan 1, 1989
4.522 bln
+350.0 mln
8.39%
jan 1, 1990
4.709 bln
+187.0 mln
4.14%
jan 1, 1991
5.615 bln
+906.0 mln
19.24%
jan 1, 1992
6.559 bln
+944.0 mln
16.81%
jan 1, 1993
7.351 bln
+792.0 mln
12.08%
jan 1, 1994
6.72 bln
-631.0 mln
-8.58%
jan 1, 1995
7.4 bln
+680.0 mln
10.12%
jan 1, 1996
8.029 bln
+629.0 mln
8.5%
jan 1, 1997
9.365 bln
+1.336 bln
16.64%
jan 1, 1998
8.758 bln
-607.0 mln
-6.48%
jan 1, 1999
8.514 bln
-244.0 mln
-2.79%
jan 1, 2000
8.424 bln
-90.0 mln
-1.06%
jan 1, 2001
9.028 bln
+604.0 mln
7.17%
jan 1, 2002
9.238 bln
+210.0 mln
2.33%
jan 1, 2003
9.913 bln
+675.0 mln
7.31%
jan 1, 2004
11.93 bln
+2.017 bln
20.35%
jan 1, 2005
13.379 bln
+1.449 bln
12.15%
jan 1, 2006
16.051 bln
+2.672 bln
19.97%
jan 1, 2007
16.93 bln
+879.1 mln
5.48%
jan 1, 2008
17.837 bln
+907.4 mln
5.36%
jan 1, 2009
20.323 bln
+2.486 bln
13.93%
jan 1, 2010
17.523 bln
-2.8 bln
-13.78%
jan 1, 2011
21.41 bln
+3.886 bln
22.18%
jan 1, 2012
25.383 bln
+3.973 bln
18.56%
jan 1, 2013
24.567 bln
-815.28 mln
-3.21%
jan 1, 2014
25.121 bln
+553.48 mln
2.25%
jan 1, 2015
24.706 bln
-415.3 mln
-1.65%
jan 1, 2016
22.188 bln
-2.518 bln
-10.19%
Ranking of countries by current statistics by years


Comments: