29
/
en
AIzaSyAYiBZKx7MnpbEhh9jyipgxe19OcubqV5w
April 1, 2024
92788
Brunei Darussalam
BRN
true
2
1
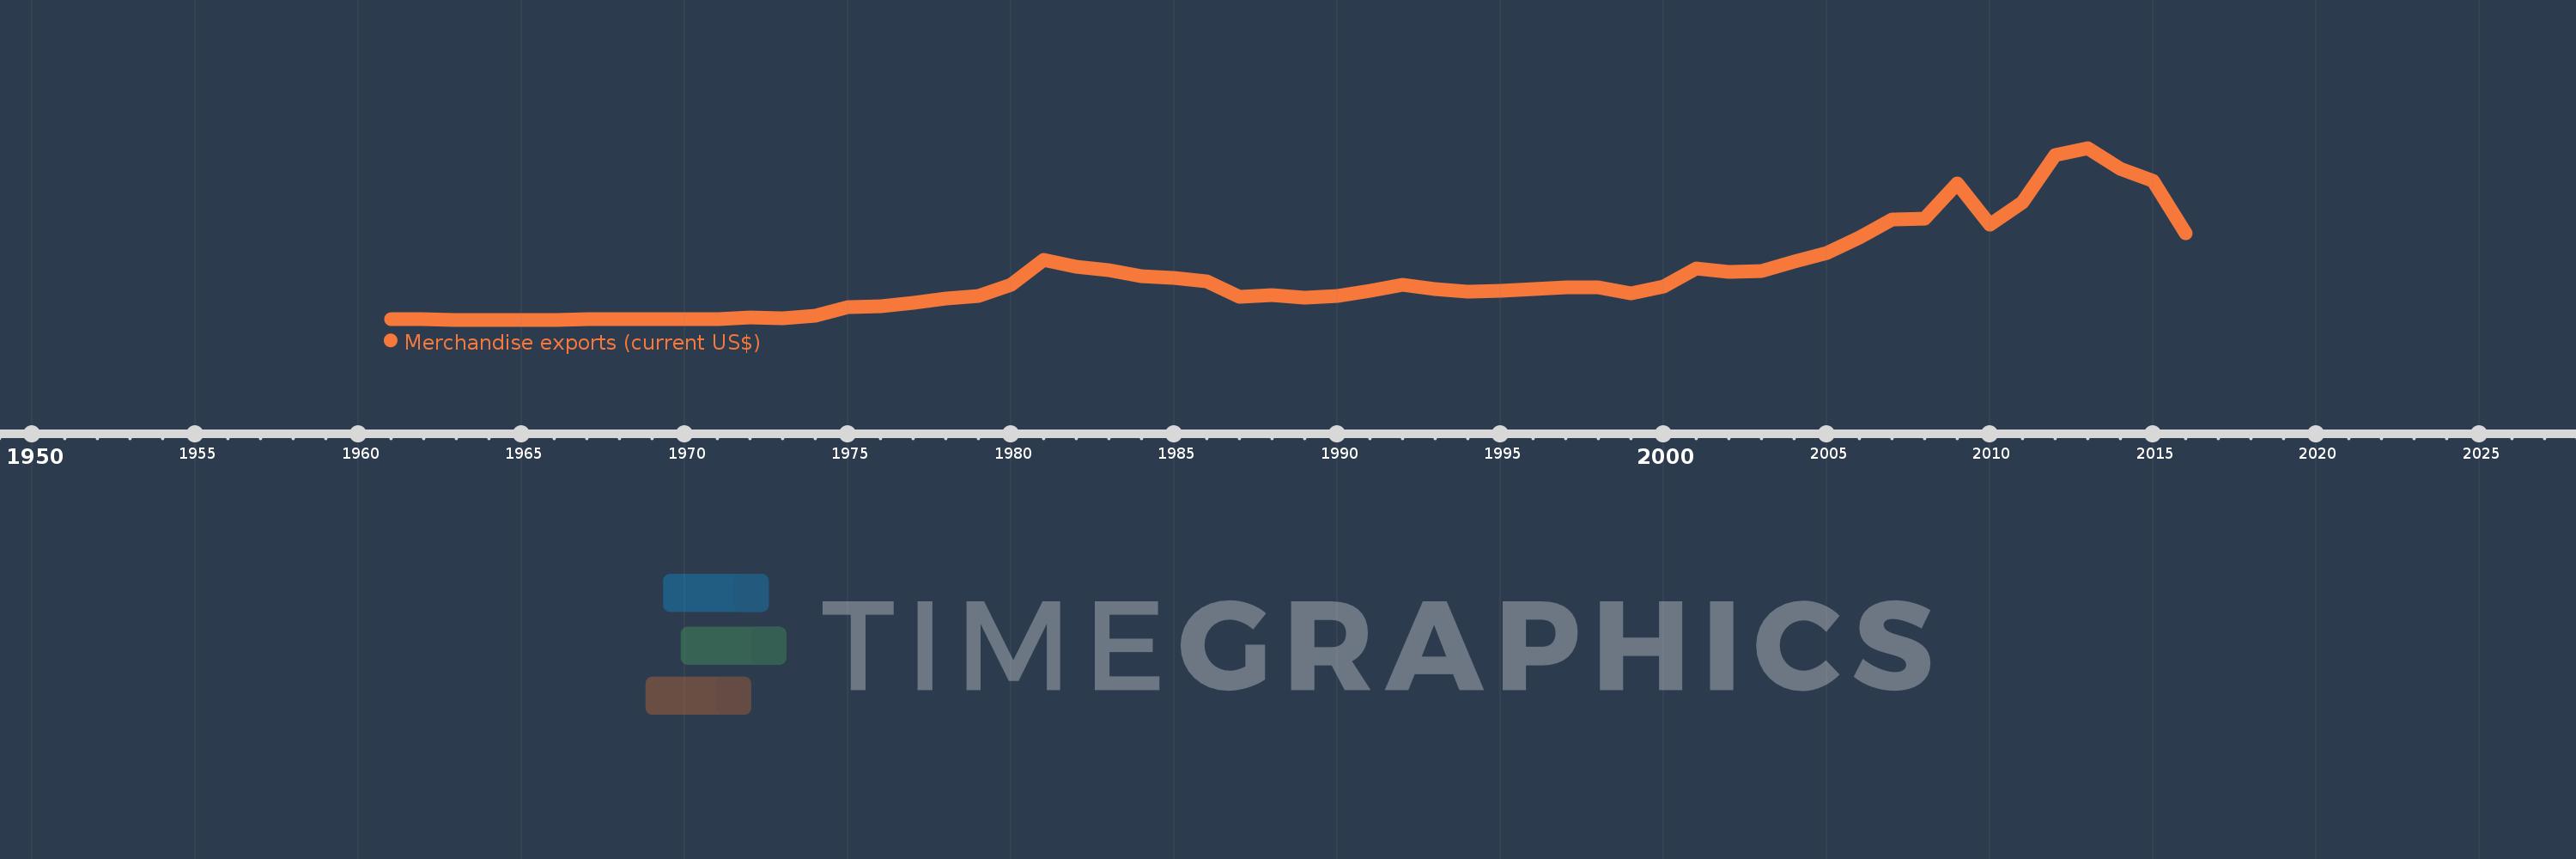
Merchandise exports (current US$)
2016,2015,2014,2013,2012,2011,2010,2009,2008,2007,2006,2005,2004,2003,2002,2001,2000,1999,1998,1997,1996,1995,1994,1993,1992,1991,1990,1989,1988,1987,1986,1985,1984,1983,1982,1981,1980,1979,1978,1977,1976,1975,1974,1973,1972,1971,1970,1969,1968,1967,1966,1965,1964,1963,1962,1961
This statistics in other country:
AfghanistanAlbaniaAlgeriaAmerican SamoaAngolaAntigua and BarbudaArab WorldArgentinaArmeniaArubaAustraliaAustriaAzerbaijanBahamas, TheBahrainBangladeshBarbadosBelarusBelgiumBelizeBeninBermudaBhutanBoliviaBosnia and HerzegovinaBotswanaBrazilBrunei DarussalamBulgariaBurkina FasoBurundiCabo VerdeCambodiaCameroonCanadaCaribbean small statesCentral African RepublicCentral Europe and the BalticsChadChileChinaColombiaComorosCongo, Dem. Rep.Congo, Rep.Costa RicaCote d'IvoireCroatiaCubaCuracaoCyprusCzech RepublicDenmarkDjiboutiDominicaDominican RepublicEarly-demographic dividendEast Asia & PacificEast Asia & Pacific (excluding high income)East Asia & Pacific (IDA & IBRD countries)EcuadorEgypt, Arab Rep.El SalvadorEquatorial GuineaEritreaEstoniaEthiopiaEuro areaEurope & Central AsiaEurope & Central Asia (excluding high income)Europe & Central Asia (IDA & IBRD countries)European UnionFaroe IslandsFijiFinlandFragile and conflict affected situationsFranceFrench PolynesiaGabonGambia, TheGeorgiaGermanyGhanaGreeceGreenlandGrenadaGuamGuatemalaGuineaGuinea-BissauGuyanaHaitiHeavily indebted poor countries (HIPC)High incomeHondurasHong Kong SAR, ChinaHungaryIBRD onlyIcelandIDA & IBRD totalIDA blendIDA onlyIDA totalIndiaIndonesiaIran, Islamic Rep.IraqIrelandIsraelItalyJamaicaJapanJordanKazakhstanKenyaKiribatiKorea, Dem. People’s Rep.Korea, Rep.KuwaitKyrgyz RepublicLao PDRLate-demographic dividendLatin America & Caribbean Latin America & Caribbean (excluding high income)Latin America & the Caribbean (IDA & IBRD countries)LatviaLeast developed countries: UN classificationLebanonLesothoLiberiaLibyaLithuaniaLow & middle incomeLow incomeLower middle incomeLuxembourgMacao SAR, ChinaMacedonia, FYRMadagascarMalawiMalaysiaMaldivesMaliMaltaMarshall IslandsMauritaniaMauritiusMexicoMicronesia, Fed. Sts.Middle East & North AfricaMiddle East & North Africa (excluding high income)Middle East & North Africa (IDA & IBRD countries)Middle incomeMoldovaMongoliaMontenegroMoroccoMozambiqueMyanmarNamibiaNepalNetherlandsNew CaledoniaNew ZealandNicaraguaNigerNigeriaNorth AmericaNorthern Mariana IslandsNorwayOECD membersOmanOther small statesPacific island small statesPakistanPalauPanamaPapua New GuineaParaguayPeruPhilippinesPolandPortugalPost-demographic dividendPre-demographic dividendQatarRomaniaRussian FederationRwandaSamoaSao Tome and PrincipeSaudi ArabiaSenegalSerbiaSeychellesSierra LeoneSingaporeSint Maarten (Dutch part)Slovak RepublicSloveniaSmall statesSolomon IslandsSouth AfricaSouth AsiaSouth Asia (IDA & IBRD)SpainSri LankaSt. Kitts and NevisSt. LuciaSt. Martin (French part)St. Vincent and the GrenadinesSub-Saharan Africa Sub-Saharan Africa (excluding high income)Sub-Saharan Africa (IDA & IBRD countries)SudanSurinameSwazilandSwedenSwitzerlandSyrian Arab RepublicTajikistanTanzaniaThailandTimor-LesteTogoTongaTrinidad and TobagoTunisiaTurkeyTurkmenistanTuvaluUgandaUkraineUnited Arab EmiratesUnited KingdomUnited StatesUpper middle incomeUruguayUzbekistanVanuatuVenezuela, RBVietnamWorldYemen, Rep.ZambiaZimbabwe Timeline:
This timeline shows a graph from 1961 to 2016 of Brunei Darussalam. No data until 1960. Number of actual observations by date: 56.
Source name:
World Development Indicators
Source organization:
World Trade Organization.
Categories, topics:
Private Sector, Trade
Last updated:
apr 23, 2017
Indicators value changes by year
Minimum:
60.0 mln
jan 1, 1964
Maximum:
13.001 bln
jan 1, 2013
At the date of observation
Value
Absolute change
Change from previous value
jan 1, 1961
83.0 mln
+83.0 mln
0.0%
jan 1, 1962
77.0 mln
-6.0 mln
-7.23%
jan 1, 1963
65.0 mln
-12.0 mln
-15.58%
jan 1, 1964
60.0 mln
-5.0 mln
-7.69%
jan 1, 1965
61.0 mln
+1000.0K
1.67%
jan 1, 1966
65.0 mln
+4.0 mln
6.56%
jan 1, 1967
74.0 mln
+9.0 mln
13.85%
jan 1, 1968
81.0 mln
+7.0 mln
9.46%
jan 1, 1969
92.0 mln
+11.0 mln
13.58%
jan 1, 1970
88.0 mln
-4.0 mln
-4.35%
jan 1, 1971
95.0 mln
+7.0 mln
7.95%
jan 1, 1972
212.0 mln
+117.0 mln
123.16%
jan 1, 1973
176.0 mln
-36.0 mln
-16.98%
jan 1, 1974
347.0 mln
+171.0 mln
97.16%
jan 1, 1975
980.0 mln
+633.0 mln
182.42%
jan 1, 1976
1.049 bln
+69.0 mln
7.04%
jan 1, 1977
1.333 bln
+284.0 mln
27.07%
jan 1, 1978
1.64 bln
+307.0 mln
23.03%
jan 1, 1979
1.845 bln
+205.0 mln
12.5%
jan 1, 1980
2.666 bln
+821.0 mln
44.5%
jan 1, 1981
4.581 bln
+1.915 bln
71.83%
jan 1, 1982
4.037 bln
-544.0 mln
-11.88%
jan 1, 1983
3.808 bln
-229.0 mln
-5.67%
jan 1, 1984
3.369 bln
-439.0 mln
-11.53%
jan 1, 1985
3.204 bln
-165.0 mln
-4.9%
jan 1, 1986
2.972 bln
-232.0 mln
-7.24%
jan 1, 1987
1.797 bln
-1.175 bln
-39.54%
jan 1, 1988
1.902 bln
+105.0 mln
5.84%
jan 1, 1989
1.708 bln
-194.0 mln
-10.2%
jan 1, 1990
1.883 bln
+175.0 mln
10.25%
jan 1, 1991
2.213 bln
+330.0 mln
17.53%
jan 1, 1992
2.682 bln
+469.0 mln
21.19%
jan 1, 1993
2.401 bln
-281.0 mln
-10.48%
jan 1, 1994
2.167 bln
-234.0 mln
-9.75%
jan 1, 1995
2.21 bln
+43.0 mln
1.98%
jan 1, 1996
2.402 bln
+192.0 mln
8.69%
jan 1, 1997
2.481 bln
+79.0 mln
3.29%
jan 1, 1998
2.467 bln
-14.0 mln
-0.56%
jan 1, 1999
2.058 bln
-409.0 mln
-16.58%
jan 1, 2000
2.579 bln
+521.0 mln
25.32%
jan 1, 2001
3.903 bln
+1.324 bln
51.34%
jan 1, 2002
3.64 bln
-263.0 mln
-6.74%
jan 1, 2003
3.702 bln
+62.0 mln
1.7%
jan 1, 2004
4.421 bln
+719.0 mln
19.42%
jan 1, 2005
5.057 bln
+636.0 mln
14.39%
jan 1, 2006
6.249 bln
+1.192 bln
23.57%
jan 1, 2007
7.636 bln
+1.387 bln
22.2%
jan 1, 2008
7.668 bln
+31.869 mln
0.42%
jan 1, 2009
10.319 bln
+2.651 bln
34.57%
jan 1, 2010
7.2 bln
-3.119 bln
-30.22%
jan 1, 2011
8.907 bln
+1.707 bln
23.71%
jan 1, 2012
12.465 bln
+3.557 bln
39.94%
jan 1, 2013
13.001 bln
+535.89 mln
4.3%
jan 1, 2014
11.447 bln
-1.554 bln
-11.95%
jan 1, 2015
10.509 bln
-938.354 mln
-8.2%
jan 1, 2016
6.6 bln
-3.909 bln
-37.2%
Ranking of countries by current statistics by years


Comments: