29
/
en
AIzaSyAYiBZKx7MnpbEhh9jyipgxe19OcubqV5w
April 1, 2024
150656
Honduras
HND
true
2
1
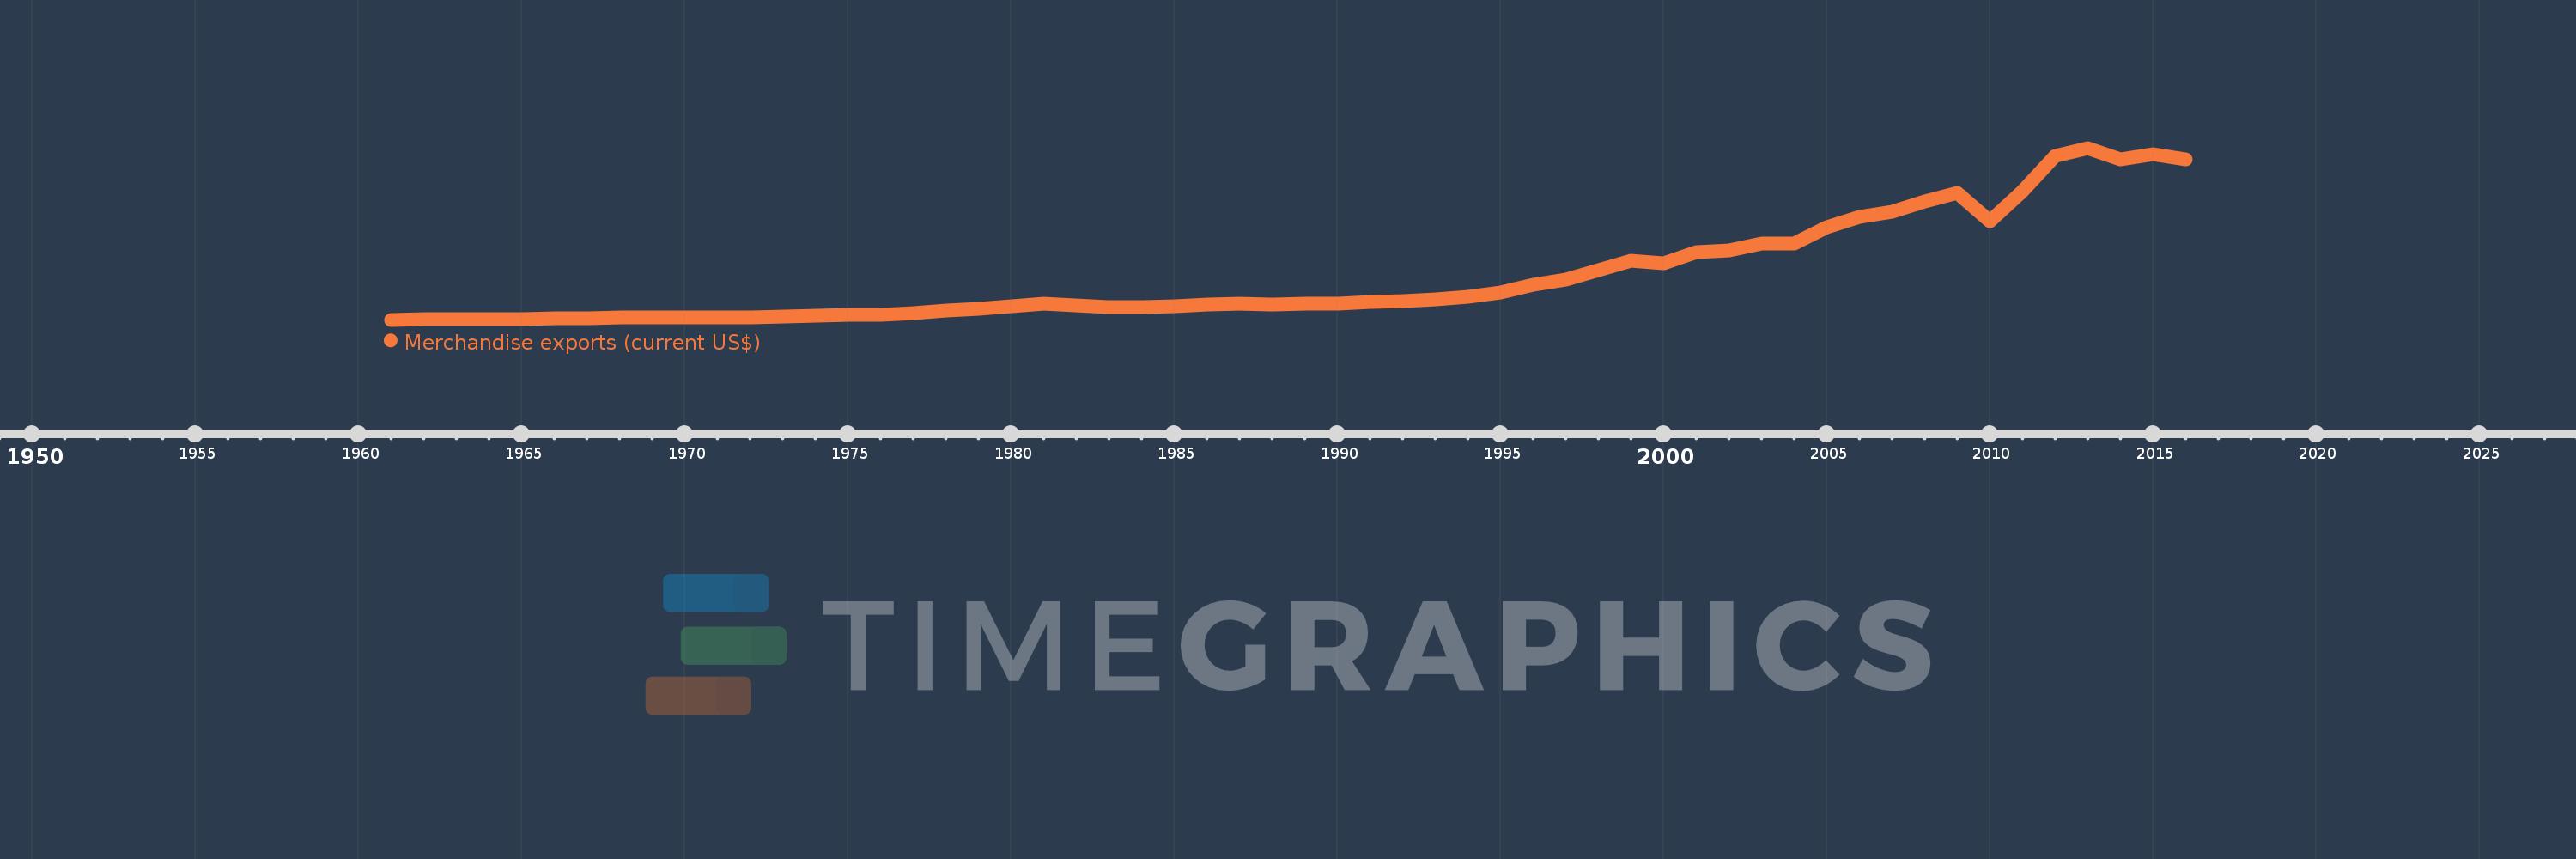
Merchandise exports (current US$)
2016,2015,2014,2013,2012,2011,2010,2009,2008,2007,2006,2005,2004,2003,2002,2001,2000,1999,1998,1997,1996,1995,1994,1993,1992,1991,1990,1989,1988,1987,1986,1985,1984,1983,1982,1981,1980,1979,1978,1977,1976,1975,1974,1973,1972,1971,1970,1969,1968,1967,1966,1965,1964,1963,1962,1961
This statistics in other country:
AfghanistanAlbaniaAlgeriaAmerican SamoaAngolaAntigua and BarbudaArab WorldArgentinaArmeniaArubaAustraliaAustriaAzerbaijanBahamas, TheBahrainBangladeshBarbadosBelarusBelgiumBelizeBeninBermudaBhutanBoliviaBosnia and HerzegovinaBotswanaBrazilBrunei DarussalamBulgariaBurkina FasoBurundiCabo VerdeCambodiaCameroonCanadaCaribbean small statesCentral African RepublicCentral Europe and the BalticsChadChileChinaColombiaComorosCongo, Dem. Rep.Congo, Rep.Costa RicaCote d'IvoireCroatiaCubaCuracaoCyprusCzech RepublicDenmarkDjiboutiDominicaDominican RepublicEarly-demographic dividendEast Asia & PacificEast Asia & Pacific (excluding high income)East Asia & Pacific (IDA & IBRD countries)EcuadorEgypt, Arab Rep.El SalvadorEquatorial GuineaEritreaEstoniaEthiopiaEuro areaEurope & Central AsiaEurope & Central Asia (excluding high income)Europe & Central Asia (IDA & IBRD countries)European UnionFaroe IslandsFijiFinlandFragile and conflict affected situationsFranceFrench PolynesiaGabonGambia, TheGeorgiaGermanyGhanaGreeceGreenlandGrenadaGuamGuatemalaGuineaGuinea-BissauGuyanaHaitiHeavily indebted poor countries (HIPC)High incomeHondurasHong Kong SAR, ChinaHungaryIBRD onlyIcelandIDA & IBRD totalIDA blendIDA onlyIDA totalIndiaIndonesiaIran, Islamic Rep.IraqIrelandIsraelItalyJamaicaJapanJordanKazakhstanKenyaKiribatiKorea, Dem. People’s Rep.Korea, Rep.KuwaitKyrgyz RepublicLao PDRLate-demographic dividendLatin America & Caribbean Latin America & Caribbean (excluding high income)Latin America & the Caribbean (IDA & IBRD countries)LatviaLeast developed countries: UN classificationLebanonLesothoLiberiaLibyaLithuaniaLow & middle incomeLow incomeLower middle incomeLuxembourgMacao SAR, ChinaMacedonia, FYRMadagascarMalawiMalaysiaMaldivesMaliMaltaMarshall IslandsMauritaniaMauritiusMexicoMicronesia, Fed. Sts.Middle East & North AfricaMiddle East & North Africa (excluding high income)Middle East & North Africa (IDA & IBRD countries)Middle incomeMoldovaMongoliaMontenegroMoroccoMozambiqueMyanmarNamibiaNepalNetherlandsNew CaledoniaNew ZealandNicaraguaNigerNigeriaNorth AmericaNorthern Mariana IslandsNorwayOECD membersOmanOther small statesPacific island small statesPakistanPalauPanamaPapua New GuineaParaguayPeruPhilippinesPolandPortugalPost-demographic dividendPre-demographic dividendQatarRomaniaRussian FederationRwandaSamoaSao Tome and PrincipeSaudi ArabiaSenegalSerbiaSeychellesSierra LeoneSingaporeSint Maarten (Dutch part)Slovak RepublicSloveniaSmall statesSolomon IslandsSouth AfricaSouth AsiaSouth Asia (IDA & IBRD)SpainSri LankaSt. Kitts and NevisSt. LuciaSt. Martin (French part)St. Vincent and the GrenadinesSub-Saharan Africa Sub-Saharan Africa (excluding high income)Sub-Saharan Africa (IDA & IBRD countries)SudanSurinameSwazilandSwedenSwitzerlandSyrian Arab RepublicTajikistanTanzaniaThailandTimor-LesteTogoTongaTrinidad and TobagoTunisiaTurkeyTurkmenistanTuvaluUgandaUkraineUnited Arab EmiratesUnited KingdomUnited StatesUpper middle incomeUruguayUzbekistanVanuatuVenezuela, RBVietnamWorldYemen, Rep.ZambiaZimbabwe Timeline:
This timeline shows a graph from 1961 to 2016 of Honduras. No data until 1960. Number of actual observations by date: 56.
Source name:
World Development Indicators
Source organization:
World Trade Organization.
Categories, topics:
Private Sector, Trade
Last updated:
apr 23, 2017
Indicators value changes by year
Minimum:
63.0 mln
jan 1, 1961
Maximum:
8.359 bln
jan 1, 2013
At the date of observation
Value
Absolute change
Change from previous value
jan 1, 1961
63.0 mln
+63.0 mln
0.0%
jan 1, 1962
72.95 mln
+9.95 mln
15.79%
jan 1, 1963
81.45 mln
+8.5 mln
11.65%
jan 1, 1964
83.3 mln
+1.85 mln
2.27%
jan 1, 1965
94.55 mln
+11.25 mln
13.51%
jan 1, 1966
127.215 mln
+32.665 mln
34.55%
jan 1, 1967
142.86 mln
+15.645 mln
12.3%
jan 1, 1968
155.225 mln
+12.365 mln
8.66%
jan 1, 1969
181.435 mln
+26.21 mln
16.89%
jan 1, 1970
168.3 mln
-13.135 mln
-7.24%
jan 1, 1971
179.105 mln
+10.805 mln
6.42%
jan 1, 1972
188.98 mln
+9.875 mln
5.51%
jan 1, 1973
204.544 mln
+15.564 mln
8.24%
jan 1, 1974
258.74 mln
+54.196 mln
26.5%
jan 1, 1975
289.13 mln
+30.39 mln
11.75%
jan 1, 1976
295.0 mln
+5.87 mln
2.03%
jan 1, 1977
400.08 mln
+105.08 mln
35.62%
jan 1, 1978
513.465 mln
+113.385 mln
28.34%
jan 1, 1979
607.56 mln
+94.095 mln
18.33%
jan 1, 1980
733.55 mln
+125.99 mln
20.74%
jan 1, 1981
830.0 mln
+96.45 mln
13.15%
jan 1, 1982
761.0 mln
-69.0 mln
-8.31%
jan 1, 1983
660.0 mln
-101.0 mln
-13.27%
jan 1, 1984
672.0 mln
+12.0 mln
1.82%
jan 1, 1985
725.0 mln
+53.0 mln
7.89%
jan 1, 1986
780.0 mln
+55.0 mln
7.59%
jan 1, 1987
854.0 mln
+74.0 mln
9.49%
jan 1, 1988
791.0 mln
-63.0 mln
-7.38%
jan 1, 1989
842.0 mln
+51.0 mln
6.45%
jan 1, 1990
859.0 mln
+17.0 mln
2.02%
jan 1, 1991
933.798 mln
+74.798 mln
8.71%
jan 1, 1992
949.156 mln
+15.357 mln
1.64%
jan 1, 1993
1.031 bln
+81.959 mln
8.63%
jan 1, 1994
1.173 bln
+142.089 mln
13.78%
jan 1, 1995
1.378 bln
+204.686 mln
17.45%
jan 1, 1996
1.769 bln
+390.819 mln
28.36%
jan 1, 1997
2.007 bln
+238.593 mln
13.49%
jan 1, 1998
2.44 bln
+432.25 mln
21.53%
jan 1, 1999
2.929 bln
+489.262 mln
20.06%
jan 1, 2000
2.777 bln
-152.082 mln
-5.19%
jan 1, 2001
3.343 bln
+566.664 mln
20.41%
jan 1, 2002
3.423 bln
+79.281 mln
2.37%
jan 1, 2003
3.745 bln
+322.209 mln
9.41%
jan 1, 2004
3.754 bln
+9.141 mln
0.24%
jan 1, 2005
4.534 bln
+779.825 mln
20.77%
jan 1, 2006
5.048 bln
+514.155 mln
11.34%
jan 1, 2007
5.277 bln
+228.557 mln
4.53%
jan 1, 2008
5.784 bln
+507.027 mln
9.61%
jan 1, 2009
6.199 bln
+414.927 mln
7.17%
jan 1, 2010
4.827 bln
-1.372 bln
-22.13%
jan 1, 2011
6.264 bln
+1.438 bln
29.78%
jan 1, 2012
7.977 bln
+1.713 bln
27.34%
jan 1, 2013
8.359 bln
+382.3 mln
4.79%
jan 1, 2014
7.805 bln
-553.9 mln
-6.63%
jan 1, 2015
8.072 bln
+266.9 mln
3.42%
jan 1, 2016
7.81 bln
-262.3 mln
-3.25%
Ranking of countries by current statistics by years


Comments: