29
/
en
AIzaSyAYiBZKx7MnpbEhh9jyipgxe19OcubqV5w
April 1, 2024
218623
Panama
PAN
true
2
1
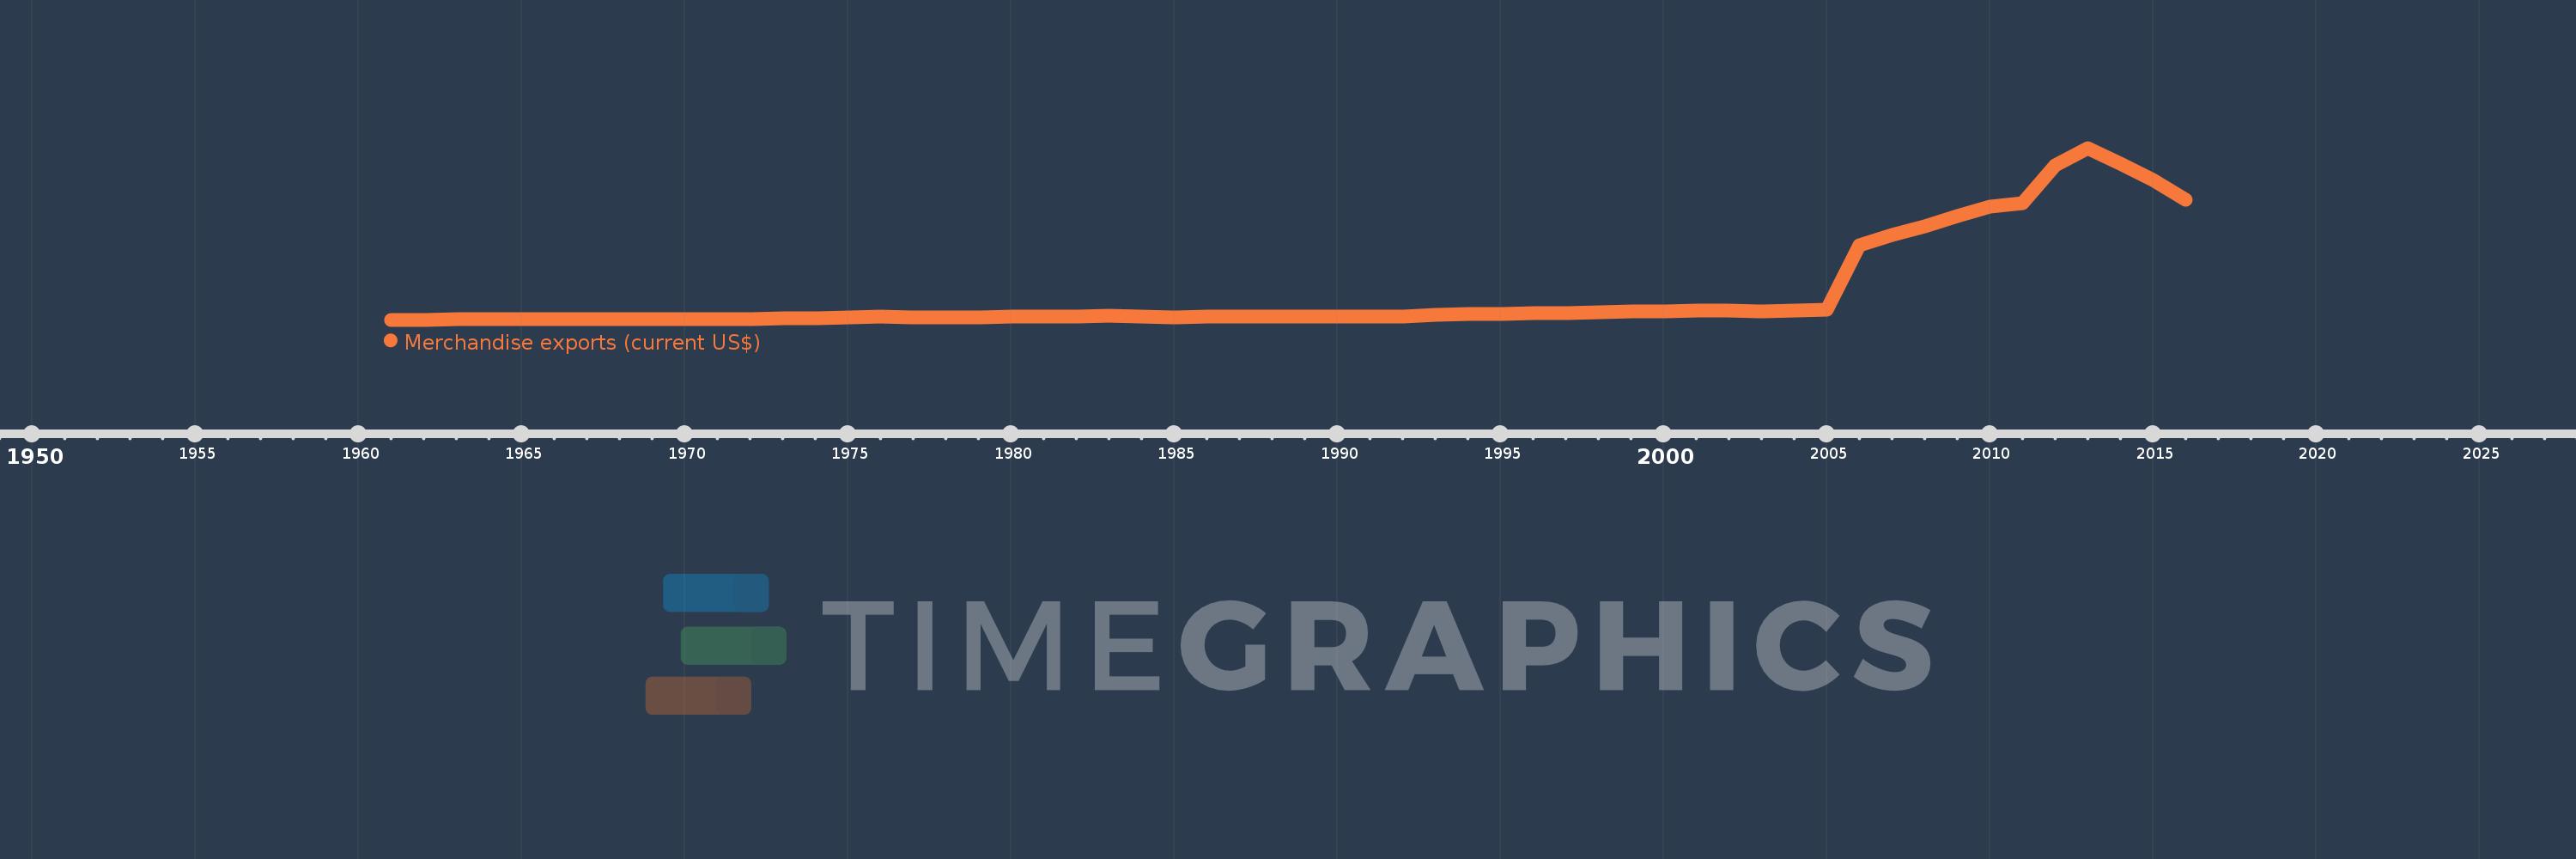
Merchandise exports (current US$)
2016,2015,2014,2013,2012,2011,2010,2009,2008,2007,2006,2005,2004,2003,2002,2001,2000,1999,1998,1997,1996,1995,1994,1993,1992,1991,1990,1989,1988,1987,1986,1985,1984,1983,1982,1981,1980,1979,1978,1977,1976,1975,1974,1973,1972,1971,1970,1969,1968,1967,1966,1965,1964,1963,1962,1961
This statistics in other country:
AfghanistanAlbaniaAlgeriaAmerican SamoaAngolaAntigua and BarbudaArab WorldArgentinaArmeniaArubaAustraliaAustriaAzerbaijanBahamas, TheBahrainBangladeshBarbadosBelarusBelgiumBelizeBeninBermudaBhutanBoliviaBosnia and HerzegovinaBotswanaBrazilBrunei DarussalamBulgariaBurkina FasoBurundiCabo VerdeCambodiaCameroonCanadaCaribbean small statesCentral African RepublicCentral Europe and the BalticsChadChileChinaColombiaComorosCongo, Dem. Rep.Congo, Rep.Costa RicaCote d'IvoireCroatiaCubaCuracaoCyprusCzech RepublicDenmarkDjiboutiDominicaDominican RepublicEarly-demographic dividendEast Asia & PacificEast Asia & Pacific (excluding high income)East Asia & Pacific (IDA & IBRD countries)EcuadorEgypt, Arab Rep.El SalvadorEquatorial GuineaEritreaEstoniaEthiopiaEuro areaEurope & Central AsiaEurope & Central Asia (excluding high income)Europe & Central Asia (IDA & IBRD countries)European UnionFaroe IslandsFijiFinlandFragile and conflict affected situationsFranceFrench PolynesiaGabonGambia, TheGeorgiaGermanyGhanaGreeceGreenlandGrenadaGuamGuatemalaGuineaGuinea-BissauGuyanaHaitiHeavily indebted poor countries (HIPC)High incomeHondurasHong Kong SAR, ChinaHungaryIBRD onlyIcelandIDA & IBRD totalIDA blendIDA onlyIDA totalIndiaIndonesiaIran, Islamic Rep.IraqIrelandIsraelItalyJamaicaJapanJordanKazakhstanKenyaKiribatiKorea, Dem. People’s Rep.Korea, Rep.KuwaitKyrgyz RepublicLao PDRLate-demographic dividendLatin America & Caribbean Latin America & Caribbean (excluding high income)Latin America & the Caribbean (IDA & IBRD countries)LatviaLeast developed countries: UN classificationLebanonLesothoLiberiaLibyaLithuaniaLow & middle incomeLow incomeLower middle incomeLuxembourgMacao SAR, ChinaMacedonia, FYRMadagascarMalawiMalaysiaMaldivesMaliMaltaMarshall IslandsMauritaniaMauritiusMexicoMicronesia, Fed. Sts.Middle East & North AfricaMiddle East & North Africa (excluding high income)Middle East & North Africa (IDA & IBRD countries)Middle incomeMoldovaMongoliaMontenegroMoroccoMozambiqueMyanmarNamibiaNepalNetherlandsNew CaledoniaNew ZealandNicaraguaNigerNigeriaNorth AmericaNorthern Mariana IslandsNorwayOECD membersOmanOther small statesPacific island small statesPakistanPalauPanamaPapua New GuineaParaguayPeruPhilippinesPolandPortugalPost-demographic dividendPre-demographic dividendQatarRomaniaRussian FederationRwandaSamoaSao Tome and PrincipeSaudi ArabiaSenegalSerbiaSeychellesSierra LeoneSingaporeSint Maarten (Dutch part)Slovak RepublicSloveniaSmall statesSolomon IslandsSouth AfricaSouth AsiaSouth Asia (IDA & IBRD)SpainSri LankaSt. Kitts and NevisSt. LuciaSt. Martin (French part)St. Vincent and the GrenadinesSub-Saharan Africa Sub-Saharan Africa (excluding high income)Sub-Saharan Africa (IDA & IBRD countries)SudanSurinameSwazilandSwedenSwitzerlandSyrian Arab RepublicTajikistanTanzaniaThailandTimor-LesteTogoTongaTrinidad and TobagoTunisiaTurkeyTurkmenistanTuvaluUgandaUkraineUnited Arab EmiratesUnited KingdomUnited StatesUpper middle incomeUruguayUzbekistanVanuatuVenezuela, RBVietnamWorldYemen, Rep.ZambiaZimbabwe Timeline:
This timeline shows a graph from 1961 to 2016 of Panama. No data until 1960. Number of actual observations by date: 56.
Source name:
World Development Indicators
Source organization:
World Trade Organization.
Categories, topics:
Private Sector, Trade
Last updated:
apr 23, 2017
Indicators value changes by year
Minimum:
21.236 mln
jan 1, 1961
Maximum:
16.215 bln
jan 1, 2013
At the date of observation
Value
Absolute change
Change from previous value
jan 1, 1961
21.236 mln
+21.236 mln
0.0%
jan 1, 1962
23.506 mln
+2.27 mln
10.69%
jan 1, 1963
39.538 mln
+16.032 mln
68.2%
jan 1, 1964
48.561 mln
+9.023 mln
22.82%
jan 1, 1965
60.988 mln
+12.427 mln
25.59%
jan 1, 1966
70.169 mln
+9.181 mln
15.05%
jan 1, 1967
79.744 mln
+9.575 mln
13.65%
jan 1, 1968
86.355 mln
+6.611 mln
8.29%
jan 1, 1969
95.335 mln
+8.98 mln
10.4%
jan 1, 1970
110.518 mln
+15.183 mln
15.93%
jan 1, 1971
109.497 mln
-1.021 mln
-0.92%
jan 1, 1972
116.54 mln
+7.043 mln
6.43%
jan 1, 1973
122.634 mln
+6.094 mln
5.23%
jan 1, 1974
137.774 mln
+15.14 mln
12.35%
jan 1, 1975
210.511 mln
+72.737 mln
52.79%
jan 1, 1976
286.446 mln
+75.935 mln
36.07%
jan 1, 1977
238.212 mln
-48.234 mln
-16.84%
jan 1, 1978
251.034 mln
+12.822 mln
5.38%
jan 1, 1979
256.433 mln
+5.399 mln
2.15%
jan 1, 1980
302.893 mln
+46.46 mln
18.12%
jan 1, 1981
358.0 mln
+55.107 mln
18.19%
jan 1, 1982
328.0 mln
-30.0 mln
-8.38%
jan 1, 1983
371.0 mln
+43.0 mln
13.11%
jan 1, 1984
321.0 mln
-50.0 mln
-13.48%
jan 1, 1985
274.0 mln
-47.0 mln
-14.64%
jan 1, 1986
334.0 mln
+60.0 mln
21.9%
jan 1, 1987
349.0 mln
+15.0 mln
4.49%
jan 1, 1988
358.0 mln
+9.0 mln
2.58%
jan 1, 1989
307.0 mln
-51.0 mln
-14.25%
jan 1, 1990
318.0 mln
+11.0 mln
3.58%
jan 1, 1991
340.0 mln
+22.0 mln
6.92%
jan 1, 1992
358.0 mln
+18.0 mln
5.29%
jan 1, 1993
502.0 mln
+144.0 mln
40.22%
jan 1, 1994
553.0 mln
+51.0 mln
10.16%
jan 1, 1995
583.0 mln
+30.0 mln
5.42%
jan 1, 1996
625.0 mln
+42.0 mln
7.2%
jan 1, 1997
623.0 mln
-2.0 mln
-0.32%
jan 1, 1998
723.0 mln
+100.0 mln
16.05%
jan 1, 1999
784.0 mln
+61.0 mln
8.44%
jan 1, 2000
822.0 mln
+38.0 mln
4.85%
jan 1, 2001
859.0 mln
+37.0 mln
4.5%
jan 1, 2002
911.0 mln
+52.0 mln
6.05%
jan 1, 2003
846.0 mln
-65.0 mln
-7.14%
jan 1, 2004
864.24 mln
+18.24 mln
2.16%
jan 1, 2005
943.689 mln
+79.449 mln
9.19%
jan 1, 2006
7.05 bln
+6.106 bln
647.07%
jan 1, 2007
8.034 bln
+983.926 mln
13.96%
jan 1, 2008
8.821 bln
+786.669 mln
9.79%
jan 1, 2009
9.817 bln
+996.025 mln
11.29%
jan 1, 2010
10.717 bln
+900.067 mln
9.17%
jan 1, 2011
10.987 bln
+269.916 mln
2.52%
jan 1, 2012
14.555 bln
+3.568 bln
32.48%
jan 1, 2013
16.215 bln
+1.66 bln
11.41%
jan 1, 2014
14.755 bln
-1.46 bln
-9.0%
jan 1, 2015
13.184 bln
-1.571 bln
-10.65%
jan 1, 2016
11.3 bln
-1.884 bln
-14.29%
Ranking of countries by current statistics by years


Comments: