29
/
en
AIzaSyAYiBZKx7MnpbEhh9jyipgxe19OcubqV5w
April 1, 2024
144655
Guatemala
GTM
true
2
1
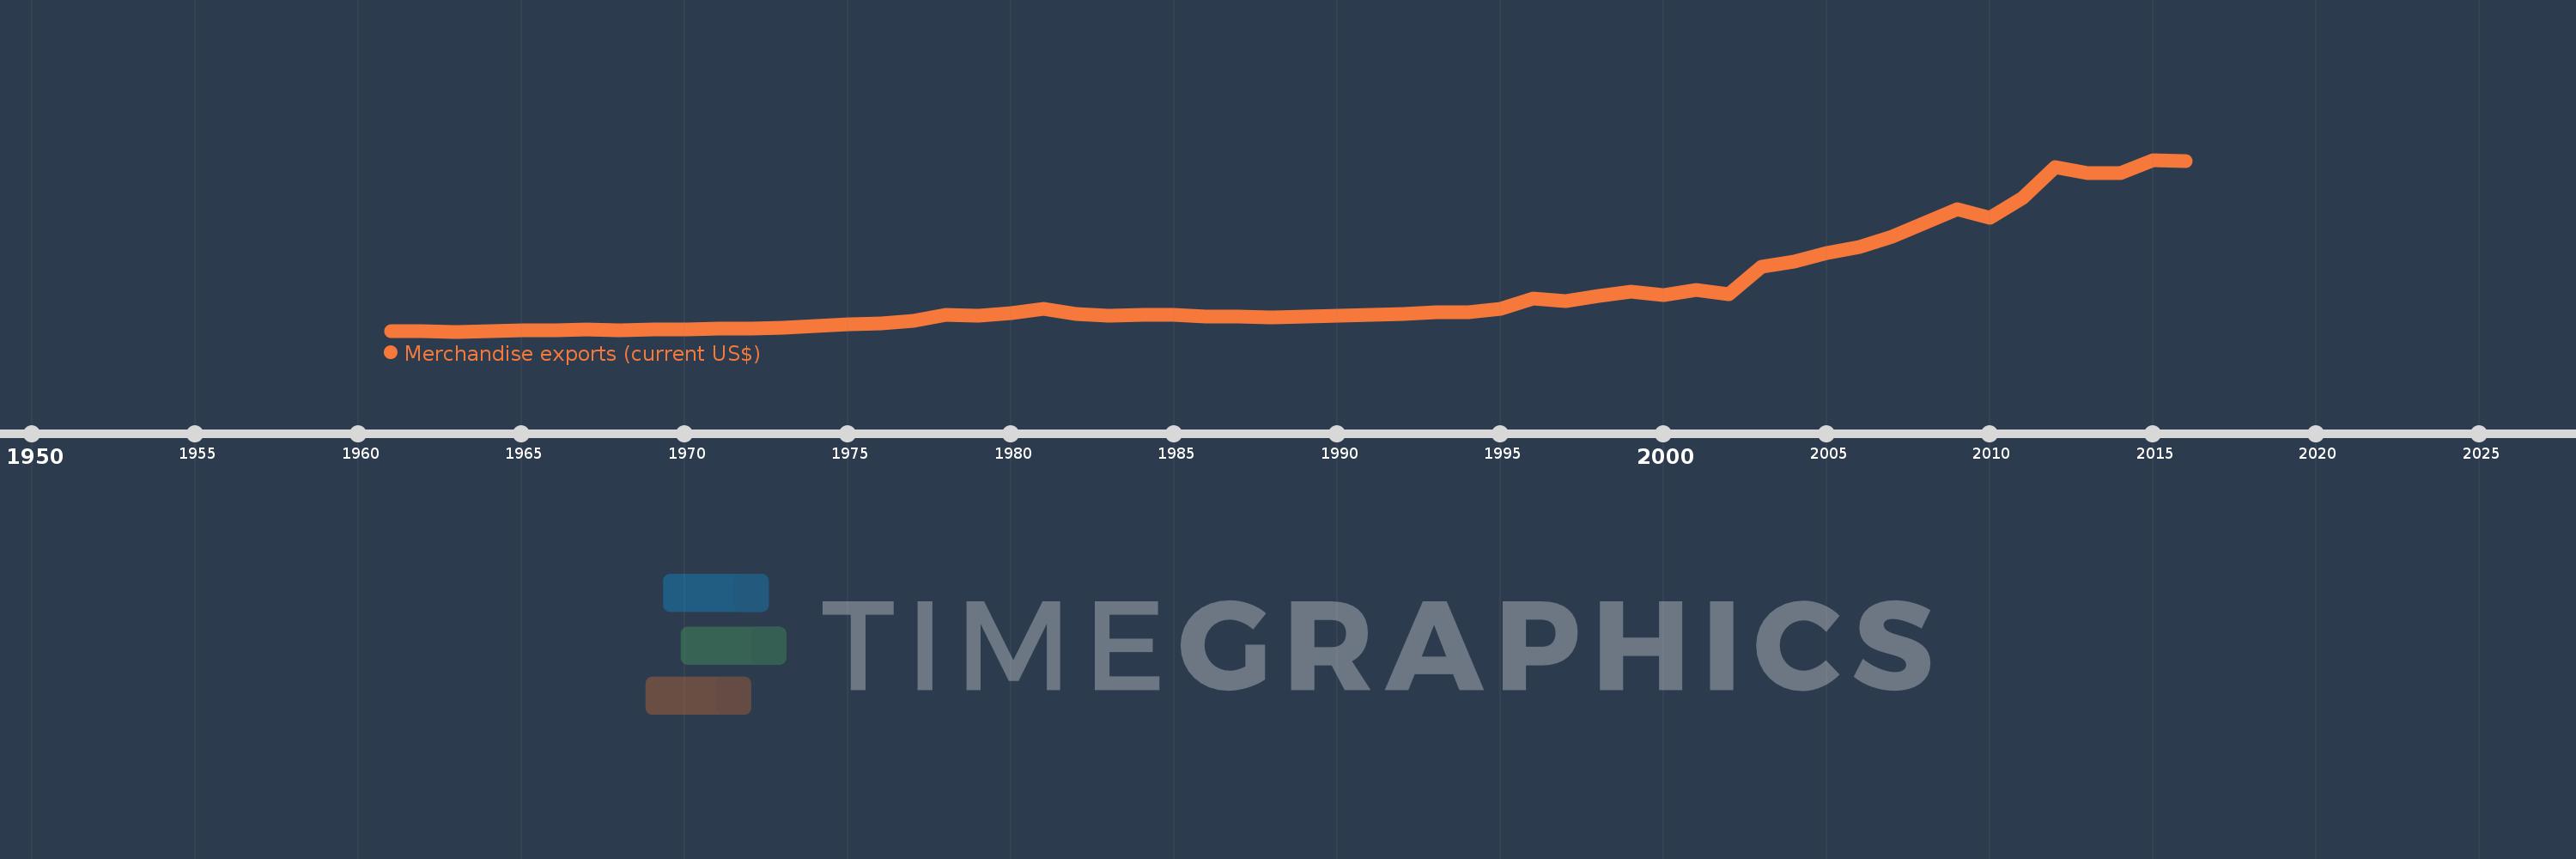
Merchandise exports (current US$)
2016,2015,2014,2013,2012,2011,2010,2009,2008,2007,2006,2005,2004,2003,2002,2001,2000,1999,1998,1997,1996,1995,1994,1993,1992,1991,1990,1989,1988,1987,1986,1985,1984,1983,1982,1981,1980,1979,1978,1977,1976,1975,1974,1973,1972,1971,1970,1969,1968,1967,1966,1965,1964,1963,1962,1961
This statistics in other country:
AfghanistanAlbaniaAlgeriaAmerican SamoaAngolaAntigua and BarbudaArab WorldArgentinaArmeniaArubaAustraliaAustriaAzerbaijanBahamas, TheBahrainBangladeshBarbadosBelarusBelgiumBelizeBeninBermudaBhutanBoliviaBosnia and HerzegovinaBotswanaBrazilBrunei DarussalamBulgariaBurkina FasoBurundiCabo VerdeCambodiaCameroonCanadaCaribbean small statesCentral African RepublicCentral Europe and the BalticsChadChileChinaColombiaComorosCongo, Dem. Rep.Congo, Rep.Costa RicaCote d'IvoireCroatiaCubaCuracaoCyprusCzech RepublicDenmarkDjiboutiDominicaDominican RepublicEarly-demographic dividendEast Asia & PacificEast Asia & Pacific (excluding high income)East Asia & Pacific (IDA & IBRD countries)EcuadorEgypt, Arab Rep.El SalvadorEquatorial GuineaEritreaEstoniaEthiopiaEuro areaEurope & Central AsiaEurope & Central Asia (excluding high income)Europe & Central Asia (IDA & IBRD countries)European UnionFaroe IslandsFijiFinlandFragile and conflict affected situationsFranceFrench PolynesiaGabonGambia, TheGeorgiaGermanyGhanaGreeceGreenlandGrenadaGuamGuatemalaGuineaGuinea-BissauGuyanaHaitiHeavily indebted poor countries (HIPC)High incomeHondurasHong Kong SAR, ChinaHungaryIBRD onlyIcelandIDA & IBRD totalIDA blendIDA onlyIDA totalIndiaIndonesiaIran, Islamic Rep.IraqIrelandIsraelItalyJamaicaJapanJordanKazakhstanKenyaKiribatiKorea, Dem. People’s Rep.Korea, Rep.KuwaitKyrgyz RepublicLao PDRLate-demographic dividendLatin America & Caribbean Latin America & Caribbean (excluding high income)Latin America & the Caribbean (IDA & IBRD countries)LatviaLeast developed countries: UN classificationLebanonLesothoLiberiaLibyaLithuaniaLow & middle incomeLow incomeLower middle incomeLuxembourgMacao SAR, ChinaMacedonia, FYRMadagascarMalawiMalaysiaMaldivesMaliMaltaMarshall IslandsMauritaniaMauritiusMexicoMicronesia, Fed. Sts.Middle East & North AfricaMiddle East & North Africa (excluding high income)Middle East & North Africa (IDA & IBRD countries)Middle incomeMoldovaMongoliaMontenegroMoroccoMozambiqueMyanmarNamibiaNepalNetherlandsNew CaledoniaNew ZealandNicaraguaNigerNigeriaNorth AmericaNorthern Mariana IslandsNorwayOECD membersOmanOther small statesPacific island small statesPakistanPalauPanamaPapua New GuineaParaguayPeruPhilippinesPolandPortugalPost-demographic dividendPre-demographic dividendQatarRomaniaRussian FederationRwandaSamoaSao Tome and PrincipeSaudi ArabiaSenegalSerbiaSeychellesSierra LeoneSingaporeSint Maarten (Dutch part)Slovak RepublicSloveniaSmall statesSolomon IslandsSouth AfricaSouth AsiaSouth Asia (IDA & IBRD)SpainSri LankaSt. Kitts and NevisSt. LuciaSt. Martin (French part)St. Vincent and the GrenadinesSub-Saharan Africa Sub-Saharan Africa (excluding high income)Sub-Saharan Africa (IDA & IBRD countries)SudanSurinameSwazilandSwedenSwitzerlandSyrian Arab RepublicTajikistanTanzaniaThailandTimor-LesteTogoTongaTrinidad and TobagoTunisiaTurkeyTurkmenistanTuvaluUgandaUkraineUnited Arab EmiratesUnited KingdomUnited StatesUpper middle incomeUruguayUzbekistanVanuatuVenezuela, RBVietnamWorldYemen, Rep.ZambiaZimbabwe Timeline:
This timeline shows a graph from 1961 to 2016 of Guatemala. No data until 1960. Number of actual observations by date: 56.
Source name:
World Development Indicators
Source organization:
World Trade Organization.
Categories, topics:
Private Sector, Trade
Last updated:
apr 23, 2017
Indicators value changes by year
Minimum:
109.3 mln
jan 1, 1963
Maximum:
10.834 bln
jan 1, 2015
At the date of observation
Value
Absolute change
Change from previous value
jan 1, 1961
112.52 mln
+112.52 mln
0.0%
jan 1, 1962
110.17 mln
-2.35 mln
-2.09%
jan 1, 1963
109.3 mln
-870.0K
-0.79%
jan 1, 1964
151.51 mln
+42.21 mln
38.62%
jan 1, 1965
164.55 mln
+13.04 mln
8.61%
jan 1, 1966
185.8 mln
+21.25 mln
12.91%
jan 1, 1967
226.12 mln
+40.32 mln
21.7%
jan 1, 1968
197.93 mln
-28.19 mln
-12.47%
jan 1, 1969
227.25 mln
+29.32 mln
14.81%
jan 1, 1970
255.41 mln
+28.16 mln
12.39%
jan 1, 1971
290.18 mln
+34.77 mln
13.61%
jan 1, 1972
283.24 mln
-6.94 mln
-2.39%
jan 1, 1973
327.48 mln
+44.24 mln
15.62%
jan 1, 1974
436.15 mln
+108.67 mln
33.18%
jan 1, 1975
572.13 mln
+135.98 mln
31.18%
jan 1, 1976
623.5 mln
+51.37 mln
8.98%
jan 1, 1977
760.36 mln
+136.86 mln
21.95%
jan 1, 1978
1.16 bln
+399.86 mln
52.59%
jan 1, 1979
1.089 bln
-70.76 mln
-6.1%
jan 1, 1980
1.241 bln
+151.94 mln
13.95%
jan 1, 1981
1.52 bln
+278.6 mln
22.44%
jan 1, 1982
1.226 bln
-294.0 mln
-19.34%
jan 1, 1983
1.12 bln
-106.0 mln
-8.65%
jan 1, 1984
1.159 bln
+39.0 mln
3.48%
jan 1, 1985
1.129 bln
-30.0 mln
-2.59%
jan 1, 1986
1.057 bln
-72.0 mln
-6.38%
jan 1, 1987
1.044 bln
-13.0 mln
-1.23%
jan 1, 1988
987.0 mln
-57.0 mln
-5.46%
jan 1, 1989
1.022 bln
+35.0 mln
3.55%
jan 1, 1990
1.108 bln
+86.0 mln
8.41%
jan 1, 1991
1.163 bln
+55.0 mln
4.96%
jan 1, 1992
1.202 bln
+39.0 mln
3.35%
jan 1, 1993
1.295 bln
+93.0 mln
7.74%
jan 1, 1994
1.34 bln
+45.0 mln
3.47%
jan 1, 1995
1.521 bln
+181.0 mln
13.51%
jan 1, 1996
2.155 bln
+634.0 mln
41.68%
jan 1, 1997
2.031 bln
-124.0 mln
-5.75%
jan 1, 1998
2.344 bln
+313.0 mln
15.41%
jan 1, 1999
2.582 bln
+238.0 mln
10.15%
jan 1, 2000
2.398 bln
-184.0 mln
-7.13%
jan 1, 2001
2.696 bln
+298.0 mln
12.43%
jan 1, 2002
2.466 bln
-230.0 mln
-8.53%
jan 1, 2003
4.162 bln
+1.696 bln
68.78%
jan 1, 2004
4.459 bln
+297.3 mln
7.14%
jan 1, 2005
5.036 bln
+577.0 mln
12.94%
jan 1, 2006
5.381 bln
+344.531 mln
6.84%
jan 1, 2007
6.025 bln
+644.232 mln
11.97%
jan 1, 2008
6.898 bln
+872.537 mln
14.48%
jan 1, 2009
7.737 bln
+839.7 mln
12.17%
jan 1, 2010
7.214 bln
-523.7 mln
-6.77%
jan 1, 2011
8.463 bln
+1.249 bln
17.31%
jan 1, 2012
10.401 bln
+1.938 bln
22.91%
jan 1, 2013
9.979 bln
-422.2 mln
-4.06%
jan 1, 2014
10.028 bln
+49.5 mln
0.5%
jan 1, 2015
10.834 bln
+805.7 mln
8.03%
jan 1, 2016
10.752 bln
-82.0 mln
-0.76%
Ranking of countries by current statistics by years


Comments: