29
/
en
AIzaSyAYiBZKx7MnpbEhh9jyipgxe19OcubqV5w
April 1, 2024
35142
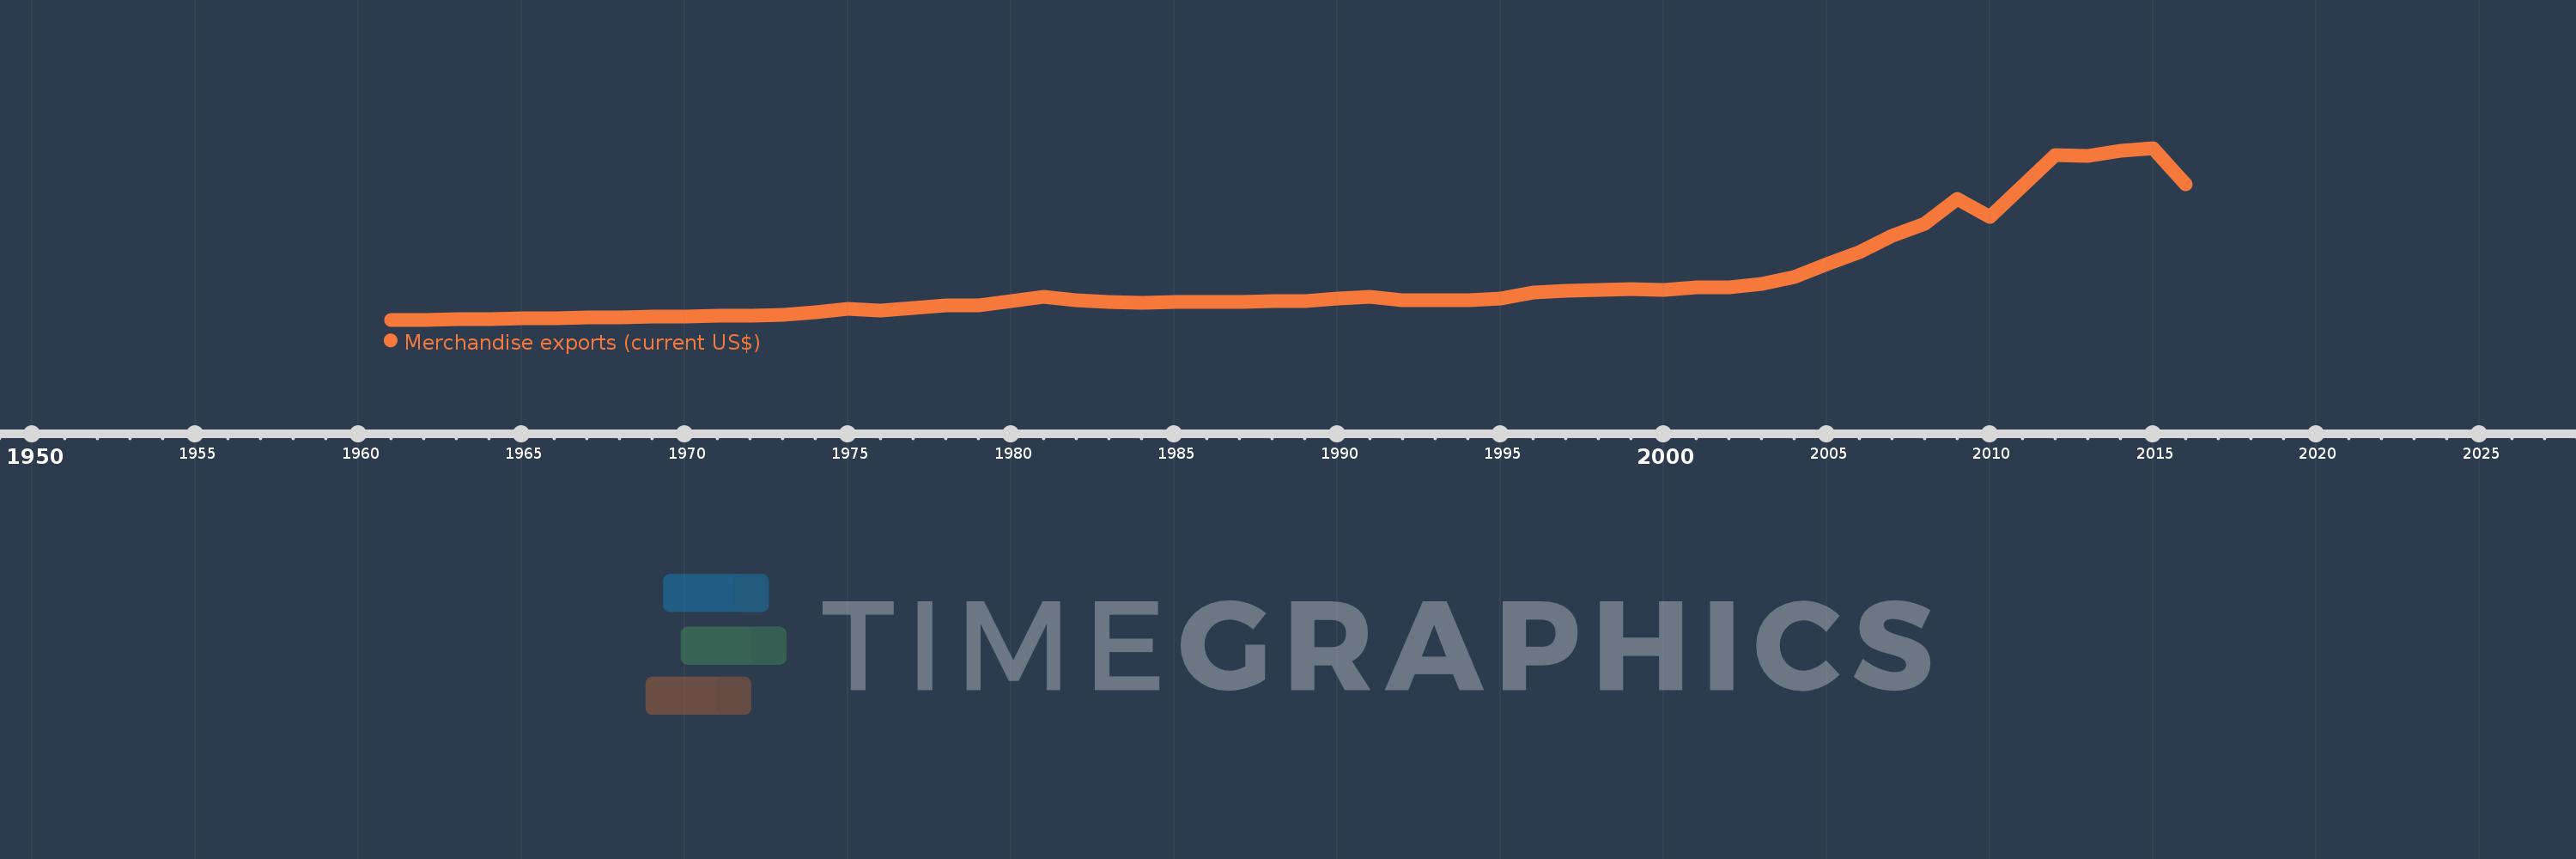
Heavily indebted poor countries (HIPC)
HPC
false
2
1
Merchandise exports (current US$)
2016,2015,2014,2013,2012,2011,2010,2009,2008,2007,2006,2005,2004,2003,2002,2001,2000,1999,1998,1997,1996,1995,1994,1993,1992,1991,1990,1989,1988,1987,1986,1985,1984,1983,1982,1981,1980,1979,1978,1977,1976,1975,1974,1973,1972,1971,1970,1969,1968,1967,1966,1965,1964,1963,1962,1961
This statistics in other country:
AfghanistanAlbaniaAlgeriaAmerican SamoaAngolaAntigua and BarbudaArab WorldArgentinaArmeniaArubaAustraliaAustriaAzerbaijanBahamas, TheBahrainBangladeshBarbadosBelarusBelgiumBelizeBeninBermudaBhutanBoliviaBosnia and HerzegovinaBotswanaBrazilBrunei DarussalamBulgariaBurkina FasoBurundiCabo VerdeCambodiaCameroonCanadaCaribbean small statesCentral African RepublicCentral Europe and the BalticsChadChileChinaColombiaComorosCongo, Dem. Rep.Congo, Rep.Costa RicaCote d'IvoireCroatiaCubaCuracaoCyprusCzech RepublicDenmarkDjiboutiDominicaDominican RepublicEarly-demographic dividendEast Asia & PacificEast Asia & Pacific (excluding high income)East Asia & Pacific (IDA & IBRD countries)EcuadorEgypt, Arab Rep.El SalvadorEquatorial GuineaEritreaEstoniaEthiopiaEuro areaEurope & Central AsiaEurope & Central Asia (excluding high income)Europe & Central Asia (IDA & IBRD countries)European UnionFaroe IslandsFijiFinlandFragile and conflict affected situationsFranceFrench PolynesiaGabonGambia, TheGeorgiaGermanyGhanaGreeceGreenlandGrenadaGuamGuatemalaGuineaGuinea-BissauGuyanaHaitiHeavily indebted poor countries (HIPC)High incomeHondurasHong Kong SAR, ChinaHungaryIBRD onlyIcelandIDA & IBRD totalIDA blendIDA onlyIDA totalIndiaIndonesiaIran, Islamic Rep.IraqIrelandIsraelItalyJamaicaJapanJordanKazakhstanKenyaKiribatiKorea, Dem. People’s Rep.Korea, Rep.KuwaitKyrgyz RepublicLao PDRLate-demographic dividendLatin America & Caribbean Latin America & Caribbean (excluding high income)Latin America & the Caribbean (IDA & IBRD countries)LatviaLeast developed countries: UN classificationLebanonLesothoLiberiaLibyaLithuaniaLow & middle incomeLow incomeLower middle incomeLuxembourgMacao SAR, ChinaMacedonia, FYRMadagascarMalawiMalaysiaMaldivesMaliMaltaMarshall IslandsMauritaniaMauritiusMexicoMicronesia, Fed. Sts.Middle East & North AfricaMiddle East & North Africa (excluding high income)Middle East & North Africa (IDA & IBRD countries)Middle incomeMoldovaMongoliaMontenegroMoroccoMozambiqueMyanmarNamibiaNepalNetherlandsNew CaledoniaNew ZealandNicaraguaNigerNigeriaNorth AmericaNorthern Mariana IslandsNorwayOECD membersOmanOther small statesPacific island small statesPakistanPalauPanamaPapua New GuineaParaguayPeruPhilippinesPolandPortugalPost-demographic dividendPre-demographic dividendQatarRomaniaRussian FederationRwandaSamoaSao Tome and PrincipeSaudi ArabiaSenegalSerbiaSeychellesSierra LeoneSingaporeSint Maarten (Dutch part)Slovak RepublicSloveniaSmall statesSolomon IslandsSouth AfricaSouth AsiaSouth Asia (IDA & IBRD)SpainSri LankaSt. Kitts and NevisSt. LuciaSt. Martin (French part)St. Vincent and the GrenadinesSub-Saharan Africa Sub-Saharan Africa (excluding high income)Sub-Saharan Africa (IDA & IBRD countries)SudanSurinameSwazilandSwedenSwitzerlandSyrian Arab RepublicTajikistanTanzaniaThailandTimor-LesteTogoTongaTrinidad and TobagoTunisiaTurkeyTurkmenistanTuvaluUgandaUkraineUnited Arab EmiratesUnited KingdomUnited StatesUpper middle incomeUruguayUzbekistanVanuatuVenezuela, RBVietnamWorldYemen, Rep.ZambiaZimbabwe Timeline:
This timeline shows a graph from 1961 to 2016 of Heavily indebted poor countries (HIPC). No data until 1960. Number of actual observations by date: 56.
Source name:
World Development Indicators
Source organization:
World Trade Organization.
Categories, topics:
Private Sector, Trade
Last updated:
apr 23, 2017
Indicators value changes by year
Minimum:
2.815 bln
jan 1, 1962
Maximum:
134.434 bln
jan 1, 2015
At the date of observation
Value
Absolute change
Change from previous value
jan 1, 1961
2.944 bln
+2.944 bln
0.0%
jan 1, 1962
2.815 bln
-128.594 mln
-4.37%
jan 1, 1963
2.978 bln
+162.761 mln
5.78%
jan 1, 1964
3.391 bln
+413.108 mln
13.87%
jan 1, 1965
3.696 bln
+305.369 mln
9.01%
jan 1, 1966
3.836 bln
+139.711 mln
3.78%
jan 1, 1967
4.266 bln
+429.412 mln
11.19%
jan 1, 1968
4.348 bln
+81.978 mln
1.92%
jan 1, 1969
4.94 bln
+592.433 mln
13.63%
jan 1, 1970
5.51 bln
+569.87 mln
11.54%
jan 1, 1971
6.006 bln
+495.704 mln
9.0%
jan 1, 1972
6.212 bln
+205.94 mln
3.43%
jan 1, 1973
6.369 bln
+157.437 mln
2.53%
jan 1, 1974
8.387 bln
+2.018 bln
31.69%
jan 1, 1975
11.055 bln
+2.668 bln
31.81%
jan 1, 1976
9.897 bln
-1.158 bln
-10.47%
jan 1, 1977
11.811 bln
+1.914 bln
19.34%
jan 1, 1978
13.947 bln
+2.136 bln
18.08%
jan 1, 1979
13.981 bln
+33.902 mln
0.24%
jan 1, 1980
17.019 bln
+3.038 bln
21.73%
jan 1, 1981
20.126 bln
+3.107 bln
18.26%
jan 1, 1982
17.585 bln
-2.541 bln
-12.63%
jan 1, 1983
16.423 bln
-1.162 bln
-6.61%
jan 1, 1984
15.892 bln
-530.505 mln
-3.23%
jan 1, 1985
16.646 bln
+753.718 mln
4.74%
jan 1, 1986
16.171 bln
-474.452 mln
-2.85%
jan 1, 1987
16.717 bln
+545.519 mln
3.37%
jan 1, 1988
17.096 bln
+379.361 mln
2.27%
jan 1, 1989
17.425 bln
+328.313 mln
1.92%
jan 1, 1990
19.152 bln
+1.728 bln
9.91%
jan 1, 1991
20.286 bln
+1.134 bln
5.92%
jan 1, 1992
17.772 bln
-2.514 bln
-12.39%
jan 1, 1993
17.807 bln
+35.092 mln
0.2%
jan 1, 1994
17.939 bln
+131.593 mln
0.74%
jan 1, 1995
19.138 bln
+1.199 bln
6.68%
jan 1, 1996
23.785 bln
+4.647 bln
24.28%
jan 1, 1997
25.268 bln
+1.484 bln
6.24%
jan 1, 1998
25.963 bln
+694.132 mln
2.75%
jan 1, 1999
26.048 bln
+85.042 mln
0.33%
jan 1, 2000
25.44 bln
-608.048 mln
-2.33%
jan 1, 2001
27.401 bln
+1.961 bln
7.71%
jan 1, 2002
27.751 bln
+350.851 mln
1.28%
jan 1, 2003
30.524 bln
+2.772 bln
9.99%
jan 1, 2004
35.671 bln
+5.147 bln
16.86%
jan 1, 2005
45.654 bln
+9.983 bln
27.99%
jan 1, 2006
54.782 bln
+9.128 bln
19.99%
jan 1, 2007
66.794 bln
+12.012 bln
21.93%
jan 1, 2008
76.304 bln
+9.509 bln
14.24%
jan 1, 2009
95.163 bln
+18.859 bln
24.72%
jan 1, 2010
81.422 bln
-13.741 bln
-14.44%
jan 1, 2011
105.177 bln
+23.755 bln
29.18%
jan 1, 2012
129.149 bln
+23.972 bln
22.79%
jan 1, 2013
128.439 bln
-710.199 mln
-0.55%
jan 1, 2014
132.485 bln
+4.046 bln
3.15%
jan 1, 2015
134.434 bln
+1.949 bln
1.47%
jan 1, 2016
106.891 bln
-27.542 bln
-20.49%
Ranking of countries by current statistics by years


Comments: