29
/
en
AIzaSyAYiBZKx7MnpbEhh9jyipgxe19OcubqV5w
April 1, 2024
81684
Belgium
BEL
true
2
1
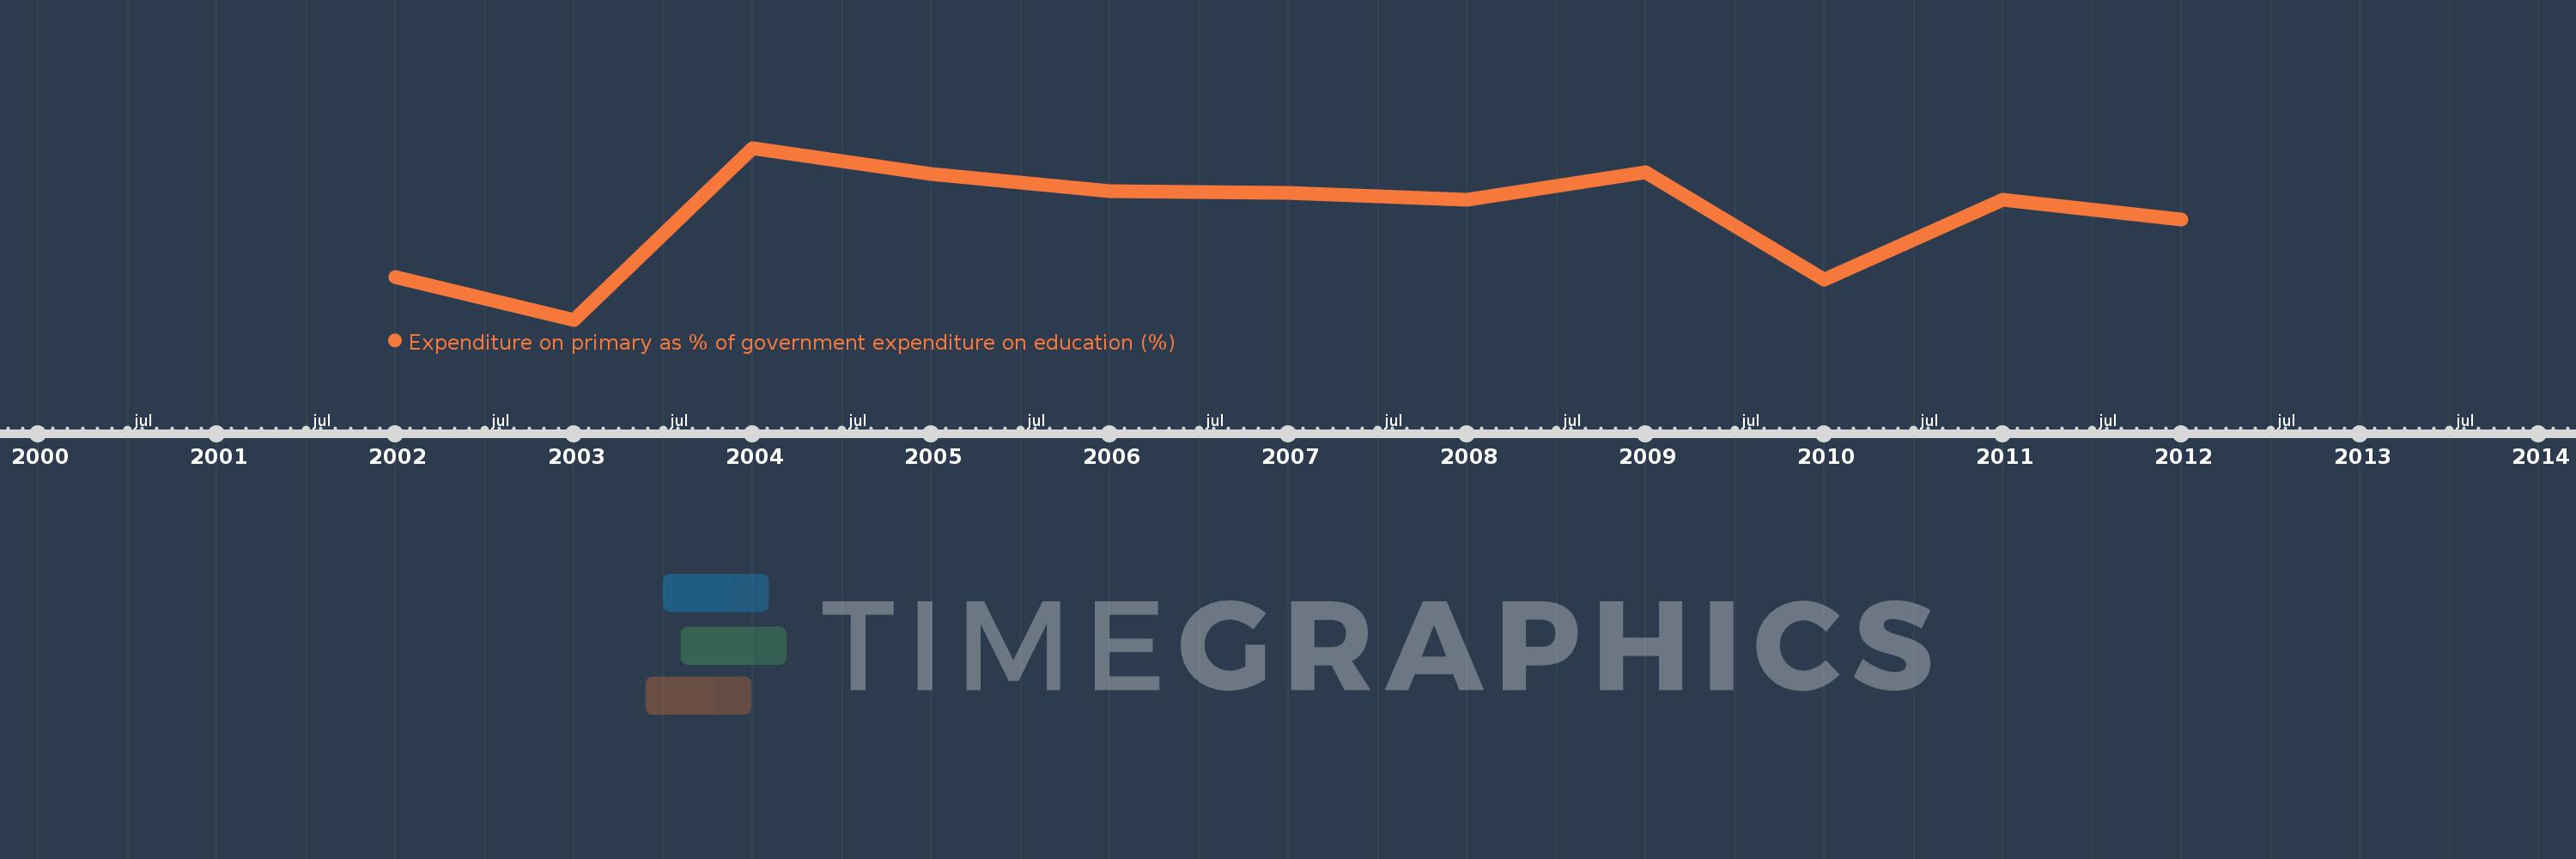
Expenditure on primary as % of government expenditure on education (%)
2012,2011,2010,2009,2008,2007,2006,2005,2004,2003,2002
This statistics in other country:
Timeline:
This timeline shows a graph from 2002 to 2012 of Belgium. No data until 2001. Number of actual observations by date: 11.
Source name:
World Development Indicators
Source organization:
UNESCO Institute for Statistics
Categories, topics:
Education
Last updated:
apr 23, 2017
Indicators value changes by year
Minimum:
22.397
jan 1, 2003
Maximum:
24.003
jan 1, 2004
At the date of observation
Value
Absolute change
Change from previous value
jan 1, 2002
22.8
+22.8
0.0%
jan 1, 2003
22.397
-0.404
-1.77%
jan 1, 2004
24.003
+1.606
7.17%
jan 1, 2005
23.757
-0.246
-1.02%
jan 1, 2006
23.6
-0.157
-0.66%
jan 1, 2007
23.584
-0.016
-0.07%
jan 1, 2008
23.516
-0.068
-0.29%
jan 1, 2009
23.779
+0.263
1.12%
jan 1, 2010
22.776
-1.002
-4.22%
jan 1, 2011
23.517
+0.74
3.25%
jan 1, 2012
23.338
-0.178
-0.76%
Ranking of countries by current statistics by years


Comments: